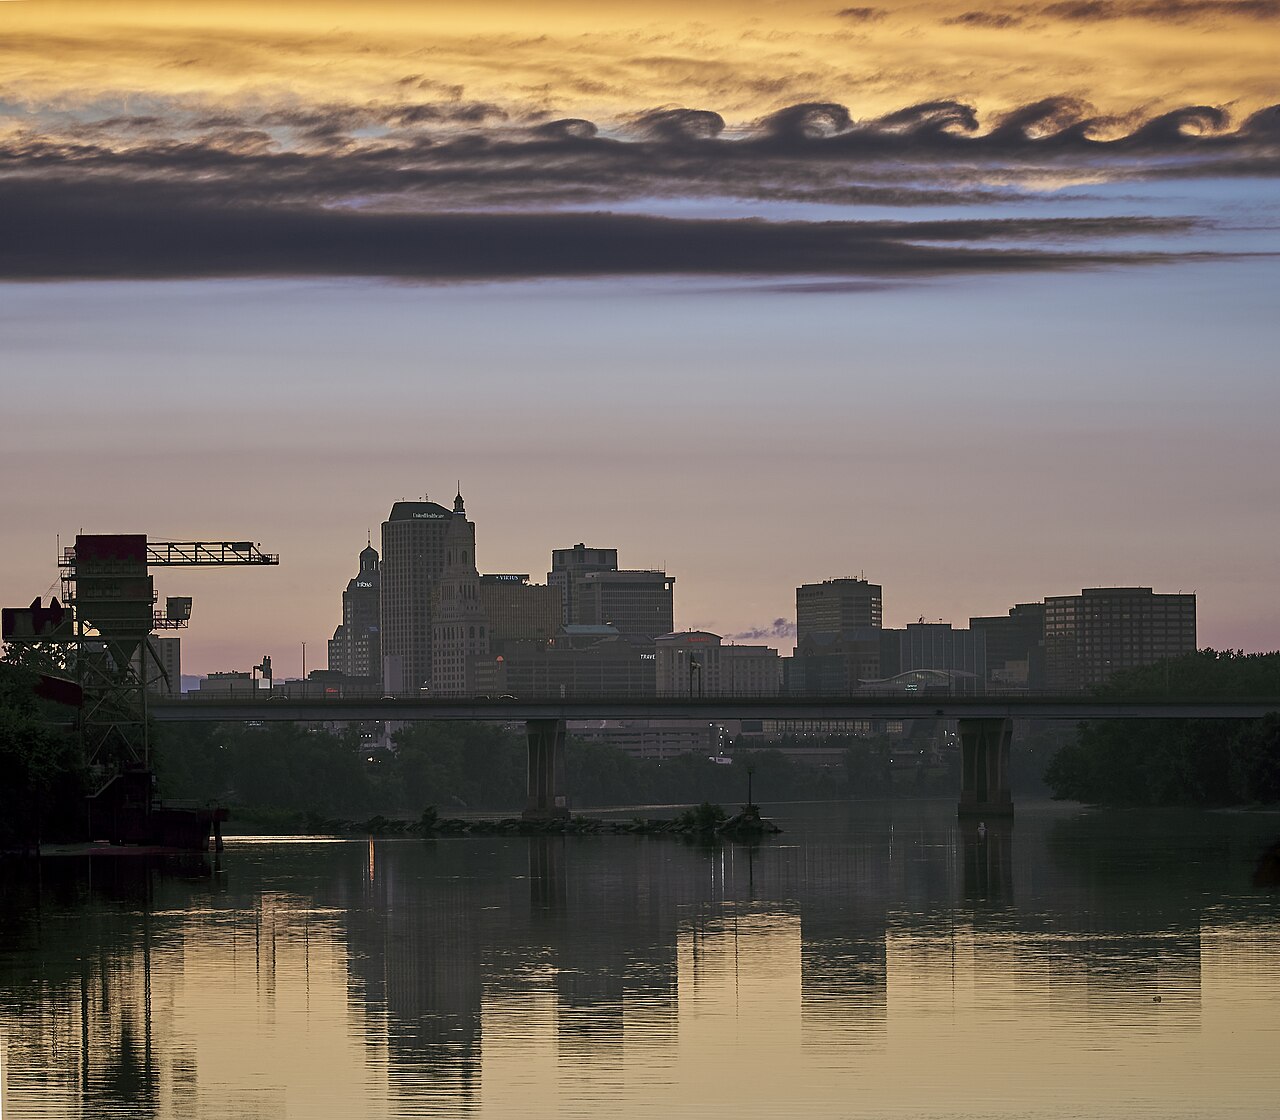
Kelvin–Helmholtz clouds are billow clouds that form when strong vertical wind shear pushes one air layer across another. The cloud top can curl into a breaking-wave shape when the air below stays stable and the air above moves much faster. In Australia, these wave clouds often show up near the Great Dividing Range, coastal inversion layers, and other places where the lower atmosphere is layered cleanly.
Key takeaways
Kelvin–Helmholtz clouds, also called billow clouds or fluctus, are wave-like cloud forms in the troposphere.
The Royal Meteorological Society describes this wave pattern as fluctus, a supplementary feature on other clouds.
The name comes from Lord Kelvin and Hermann von Helmholtz, who described the instability in fluid flows.
The same physics is described as Kelvin–Helmholtz instability, a shear-driven fluid instability caused by velocity differences across a fluid boundary, not a shear-gravity instability linked to fluctuating air density.
In Australia, they are often photographed near the Great Dividing Range and other terrain that disturbs airflow.
For pilots, wave clouds can be a sign that clear air turbulence may be nearby.
Kelvin–Helmholtz clouds Australia: what are they?
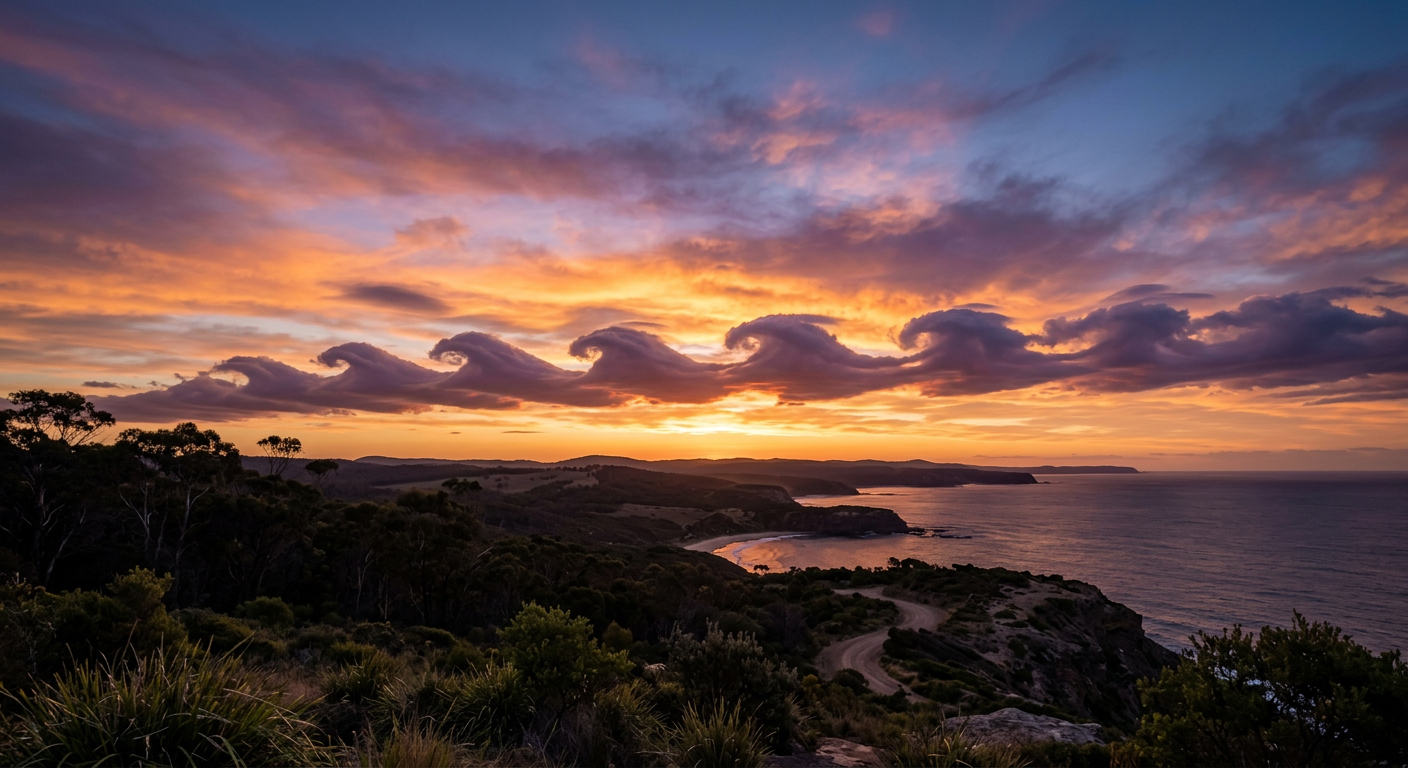
A wide view of Kelvin-Helmholtz clouds Australia showing distinct breaking wave formations at sunset.
These clouds are short-lived wave formations that can look like rows of breaking surf in the sky. The Royal Meteorological Society describes them as fluctus, a supplementary cloud feature rather than one of the main cloud types, and notes that they form in the troposphere as air layers move at different speeds.
The shape appears when a stable cloud layer is disturbed by faster air above it. The boundary between the layers starts to ripple, then curls into a series of looping crests. Because the pattern can form and fade quickly, people often spot it for only a few minutes.
How the instability works
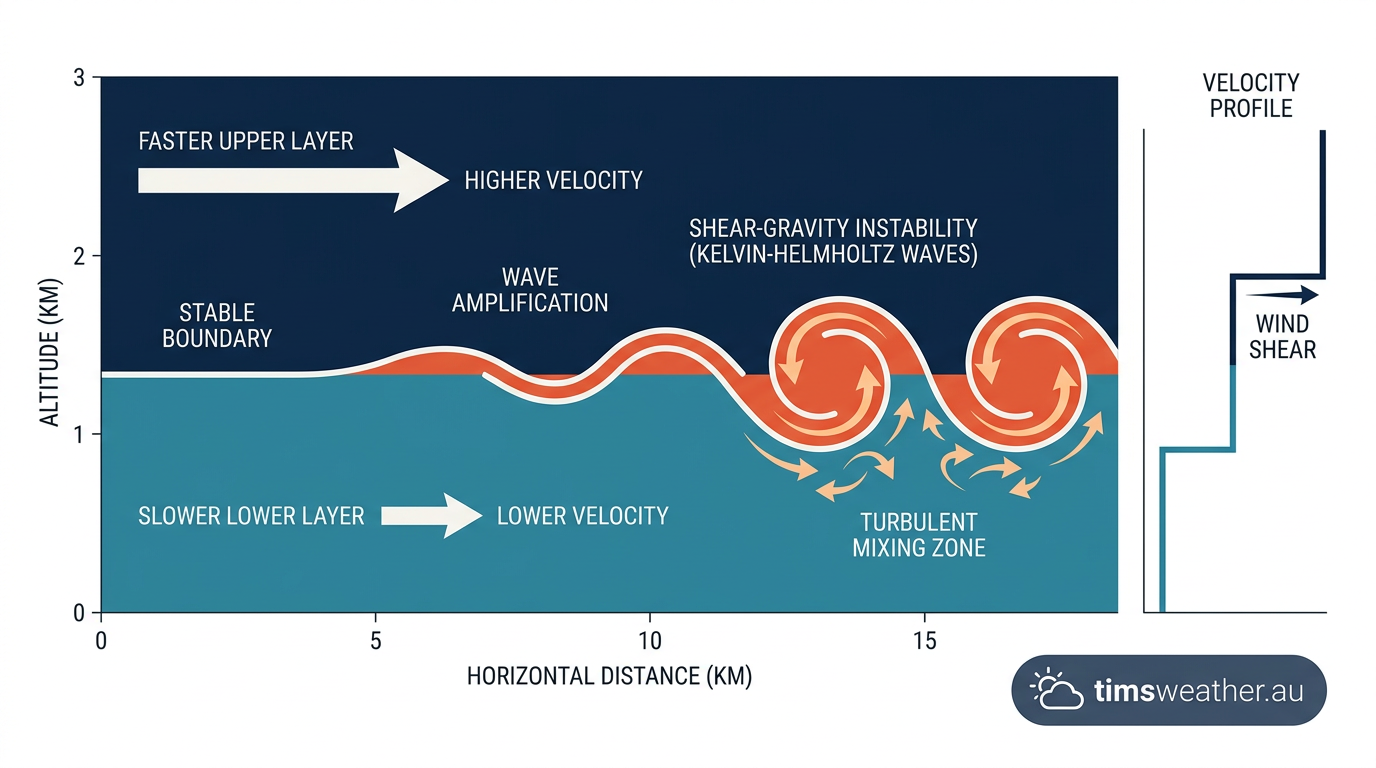
Diagram explaining the physics of wind shear and shear-gravity instability in the atmosphere.
The key process is Kelvin–Helmholtz instability. In plain terms, it happens when one layer of fluid slides over another at enough speed difference to make the boundary wobble. In the atmosphere, that fluid is air, and the moving boundary can become a train of billows.
This is a shear-gravity instability. Gravity keeps the denser air below the lighter air, but vertical wind shear pushes against that arrangement. As the difference in wind speed increases, the wave grows. The cloud top can then roll over like a breaker.
Three ingredients matter most:
Fluctuating air density between the layers
Vertical wind shear across a sharp boundary
Turbulent kinetic energy building as the wave breaks
The result is a visible sign that the atmosphere is not mixing smoothly. Instead, it is wobbling at the interface between two layers.
Why Lord Kelvin and Hermann von Helmholtz matter
The instability carries the names of Lord Kelvin and Hermann von Helmholtz because both helped explain how fluid flows become unstable. Their work began in physics, long before meteorologists used it to describe cloud tops. Today, their names are attached to one of the clearest examples of a fluid instability that people can see with the naked eye.
The cloud form itself is not a separate cloud type in the usual sense. It is a shape imposed on an existing cloud deck, most often altocumulus clouds or other stratiform clouds. That is why the same wave pattern can appear and disappear without changing the broader cloud layer.
Why inversion layers help billow clouds form
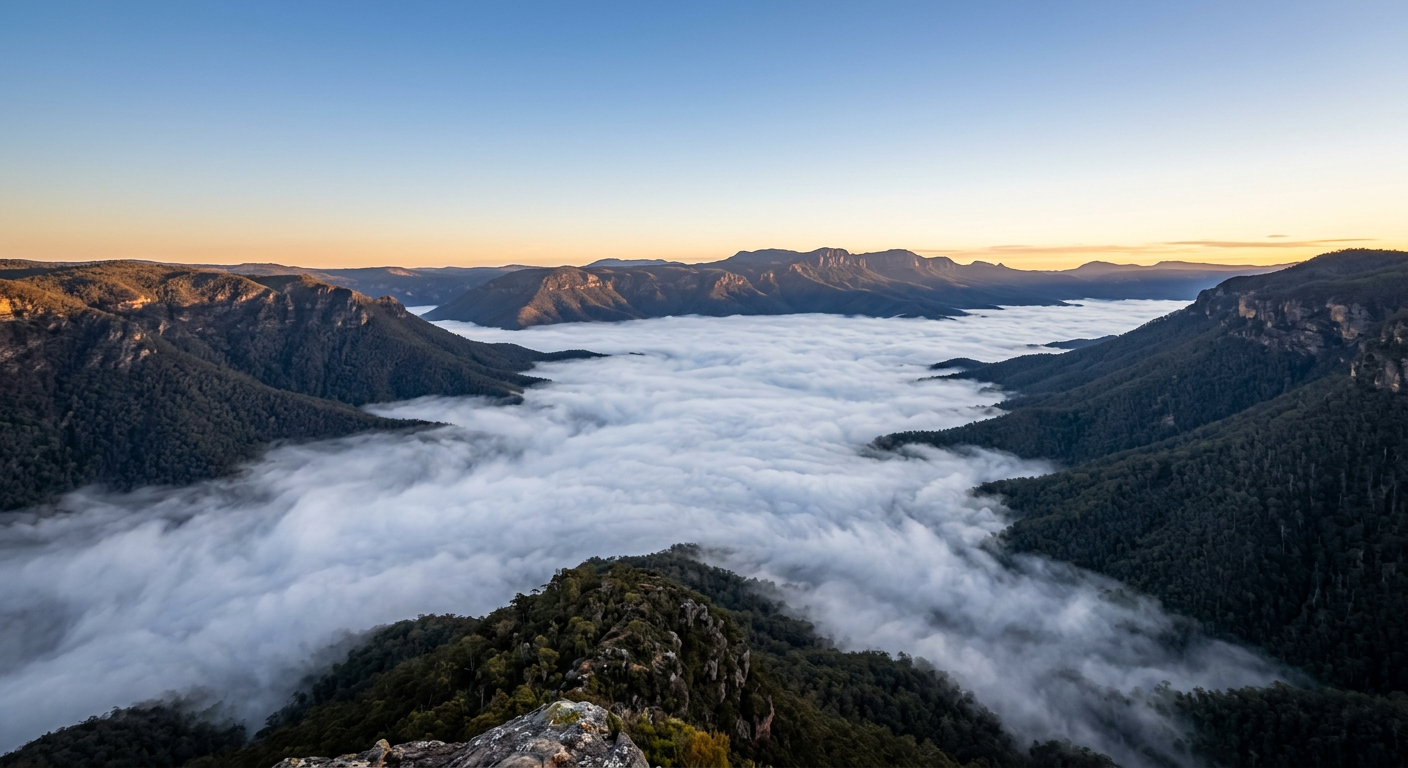
A temperature inversion layer trapping cold air in a valley, creating the boundary needed for Kelvin-Helmholtz instability.
An inversion layer is one of the best setups for Kelvin–Helmholtz clouds. Normally, air temperature falls with height through the troposphere. In an inversion, warmer air sits above cooler air and creates a strong cap that resists vertical mixing.
That cap matters because it gives the wind a clean surface to work on. If there is moisture in or near the layer, the ripples become visible as cloud crests and troughs. Without a stable layer, the same wind shear can still exist, but the wave shape is much harder to see.
BOM forecast discussions often refer to inversions and layered air when explaining cloud structure, especially on calm mornings and after cool changes. In practical terms, you are looking for a sharp boundary, light trapped below it, and stronger flow above it.
Why the Great Dividing Range often gets the best views
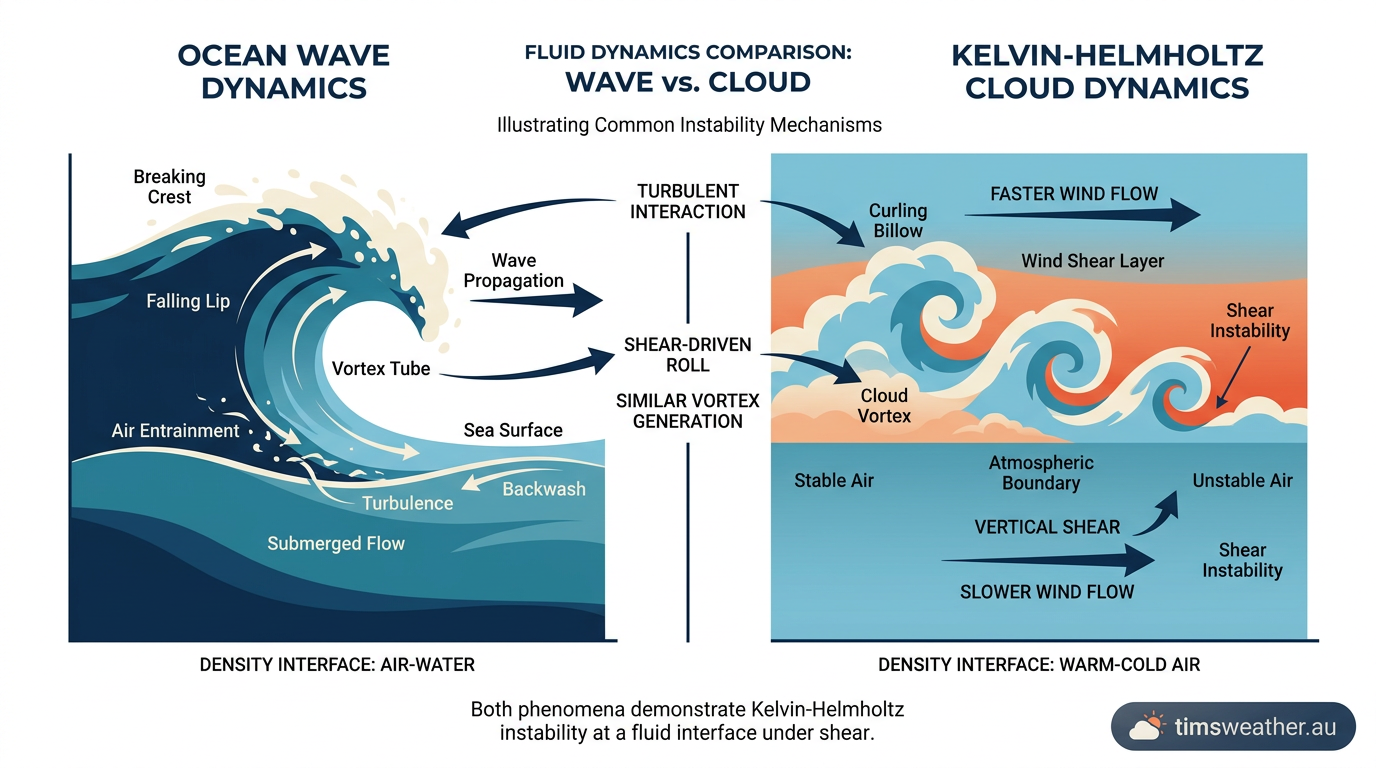
Comparison of ocean waves and wave clouds demonstrating fluid dynamics in the sky.
The Great Dividing Range is a useful place to look because terrain can force air upward and disturb the flow above it. That does not mean the mountains create the clouds by themselves. Instead, they help set up the air layers and wind shear needed for wave formation.
As air moves across high ground, it can accelerate, slow down, and change direction. That can sharpen the contrast between air layers and increase the chance of billow clouds. If you live east of the range, or you are travelling along elevated country, keep an eye on layered cloud decks after a cool change or when winds strengthen aloft.
The same effect can also happen over coastal zones where a sea breeze, a cool change, or an inversion line up in the lower atmosphere. The common thread is a stable layer with strong wind differences above it.
What Kelvin–Helmholtz clouds can tell you about the air
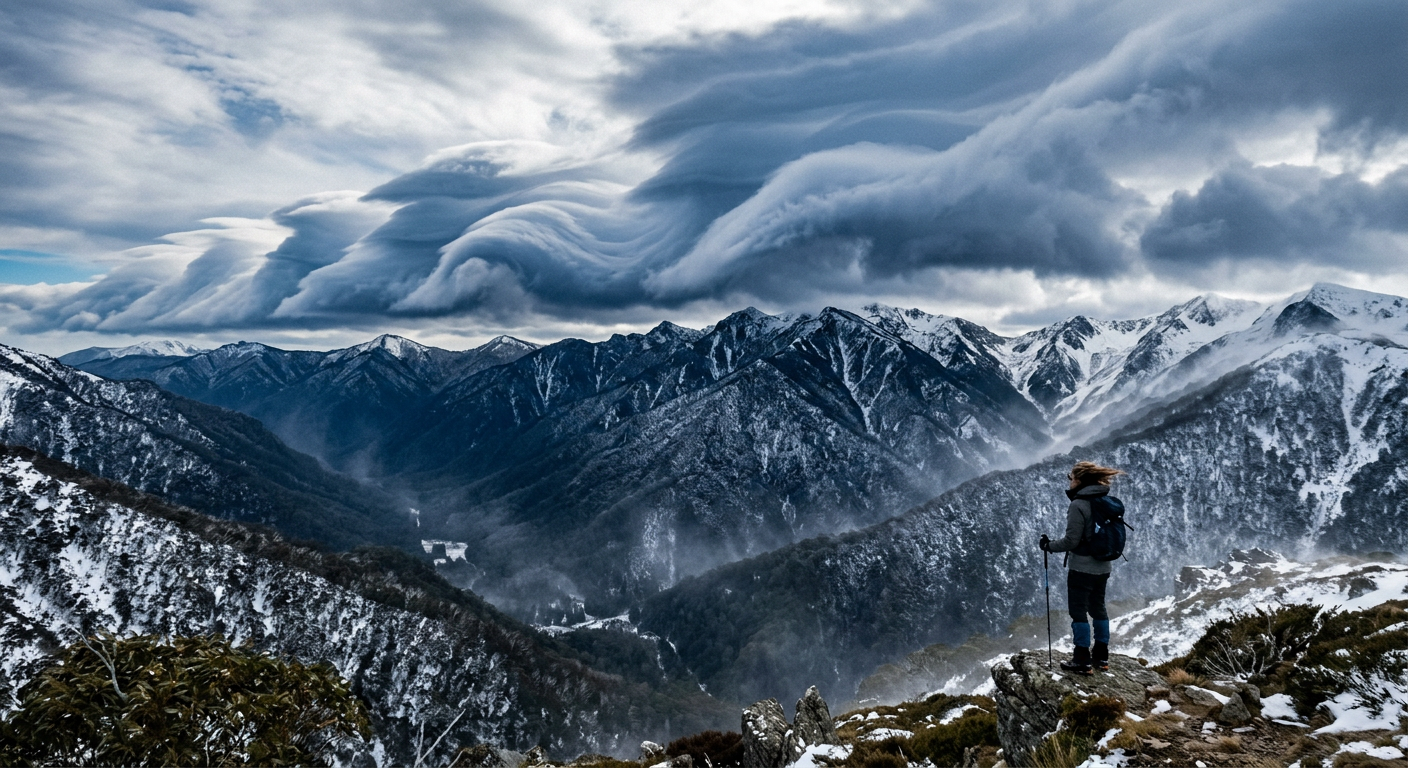
Wave clouds forming over the Great Dividing Range due to orographic lift and strong winds.
These clouds are often a clue that the atmosphere is set up for turbulence. That does not mean severe weather is on the way, but it does mean the air is slicing cleanly between layers instead of mixing evenly.
For aviation, the main concern is clear air turbulence. Pilots do not wait for cloud shapes alone, but billow clouds can point to the kind of shear that also affects flight. For everyone else, they are best treated as a signal that the lower atmosphere is layered and active, especially if the cloud deck is shifting fast.
If you want to understand why the wave shape appears, the short answer is this: the lower layer stays stable while the layer above moves faster, and the boundary between them starts to roll. That rolling motion is the visible face of the instability.
How to spot them
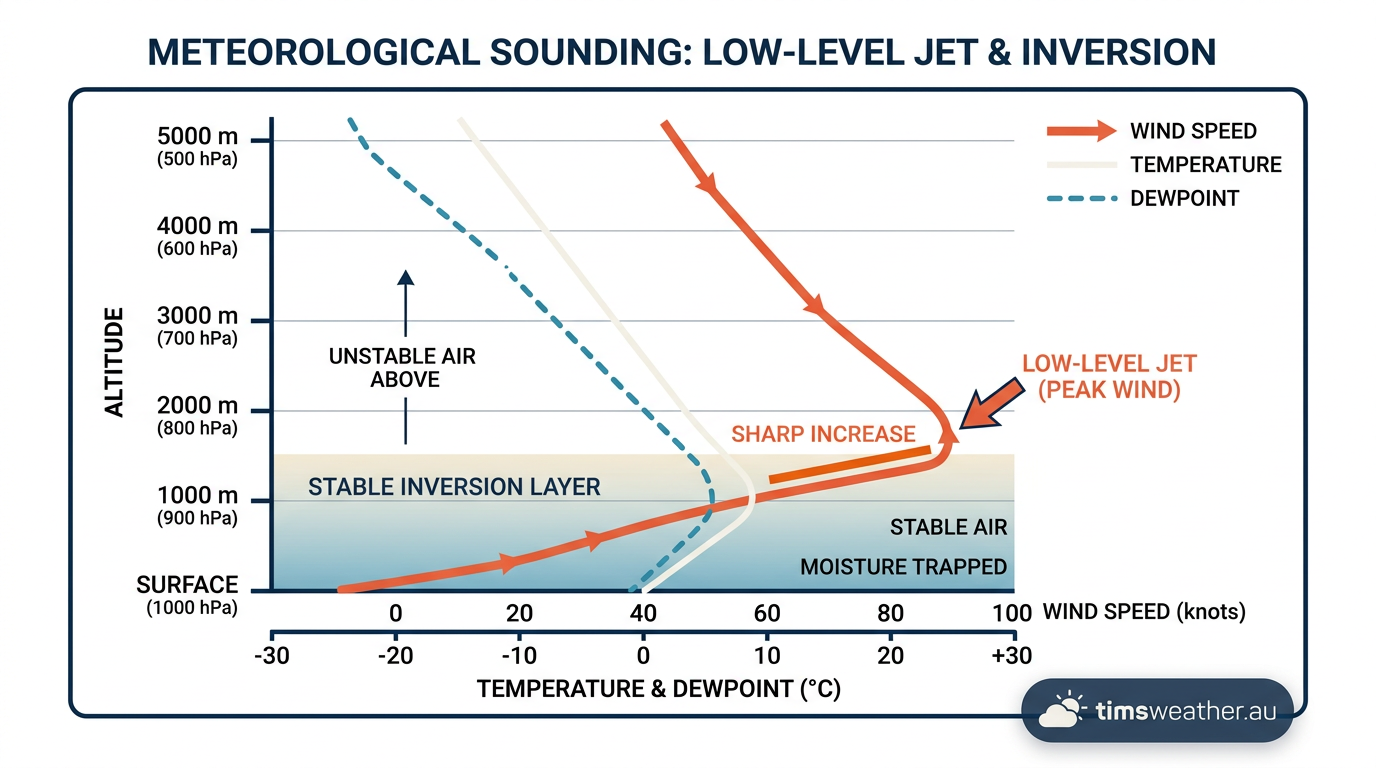
Weather chart displaying vertical wind shear and a temperature inversion used to predict billow clouds.
Look for a smooth cloud band with repeating curls along the top or edge. The best examples often appear at sunrise or sunset, when side lighting makes the wave shape easier to see. They may seem to form in a line, then fade as the wind profile changes.
Scan for a flat or layered cloud deck.
Look for a sharp edge or a rippled crest.
Check nearby terrain, especially ridges or coastal slopes.
Notice whether the cloud changes quickly from one minute to the next.
If you are photographing them, a telephoto lens can help bring out the curling edges. If you are watching for weather clues, pair the sighting with BOM forecasts for wind and cloud layers.
How Kelvin–Helmholtz clouds differ from other wave clouds
Wave clouds can take several forms, but Kelvin–Helmholtz billows are the ones that most closely resemble breaking surf. They are usually smaller and more sharply curled than broad mountain wave bands. They also tend to be shorter lived than many other cloud features.
That fleeting nature is part of their appeal. You may see only a few wave crests before the pattern smooths out. When the wind profile changes, the instability weakens and the cloud loses its curled edge.
Related guides
Frequently asked questions
These clouds form when two layers of air move at different speeds, creating wind shear that makes the boundary unstable. The faster upper air drags the slower lower layer into rolling waves. If enough moisture is present, these wave crests condense to become visible cloud billows in the sky.
Source: bom.gov.au
Further reading and resources
Explore trusted articles, books, videos and other resources to go deeper on this topic.
mountwashington.orgArticle
The Science Behind Kelvin Helmholtz Wave Clouds
In-depth coverage on Kelvin–Helmholtz Clouds Australia: How Billow Clouds Form from mountwashington.org.
en.wikipedia.orgReference
Kelvin–Helmholtz instability
Background reference on Kelvin–Helmholtz Clouds Australia: How Billow Clouds Form from en.wikipedia.org.
skybrary.aeroArticle
Kelvin-Helmholtz Waves | SKYbrary Aviation Safety
In-depth coverage on Kelvin–Helmholtz Clouds Australia: How Billow Clouds Form from skybrary.aero.
weather.metoffice.gov.ukReference
Kelvin-Helmholtz cloud
Background reference on Kelvin–Helmholtz Clouds Australia: How Billow Clouds Form from weather.metoffice.gov.uk.
earthsky.orgArticle
Kelvin-Helmholtz clouds look like ocean waves
In-depth coverage on Kelvin–Helmholtz Clouds Australia: How Billow Clouds Form from earthsky.org.
scied.ucar.eduReference
Kelvin-Helmholtz Clouds - UCAR Center for Science Education
Background reference on Kelvin–Helmholtz Clouds Australia: How Billow Clouds Form from scied.ucar.edu.
youtube.comVideo
VIDEO: Explaining Kelvin-Helmholtz Waves
Video coverage on Kelvin–Helmholtz Clouds Australia: How Billow Clouds Form from youtube.com.
eoas.ubc.caArticle
UBC ATSC 113 - Billow clouds
In-depth coverage on Kelvin–Helmholtz Clouds Australia: How Billow Clouds Form from eoas.ubc.ca.
Planning weeks ahead?
Check Australia's long-range seasonal outlook for rainfall, temperature and the climate drivers (ENSO, IOD, SAM, MJO) shaping the next three months.
View Australia's Seasonal Weather Forecast