Thunderstorm Map Australia & Storm Forecast
See Australia's thunderstorm forecast as an interactive probability map you can zoom into and tap for a reading at any location.
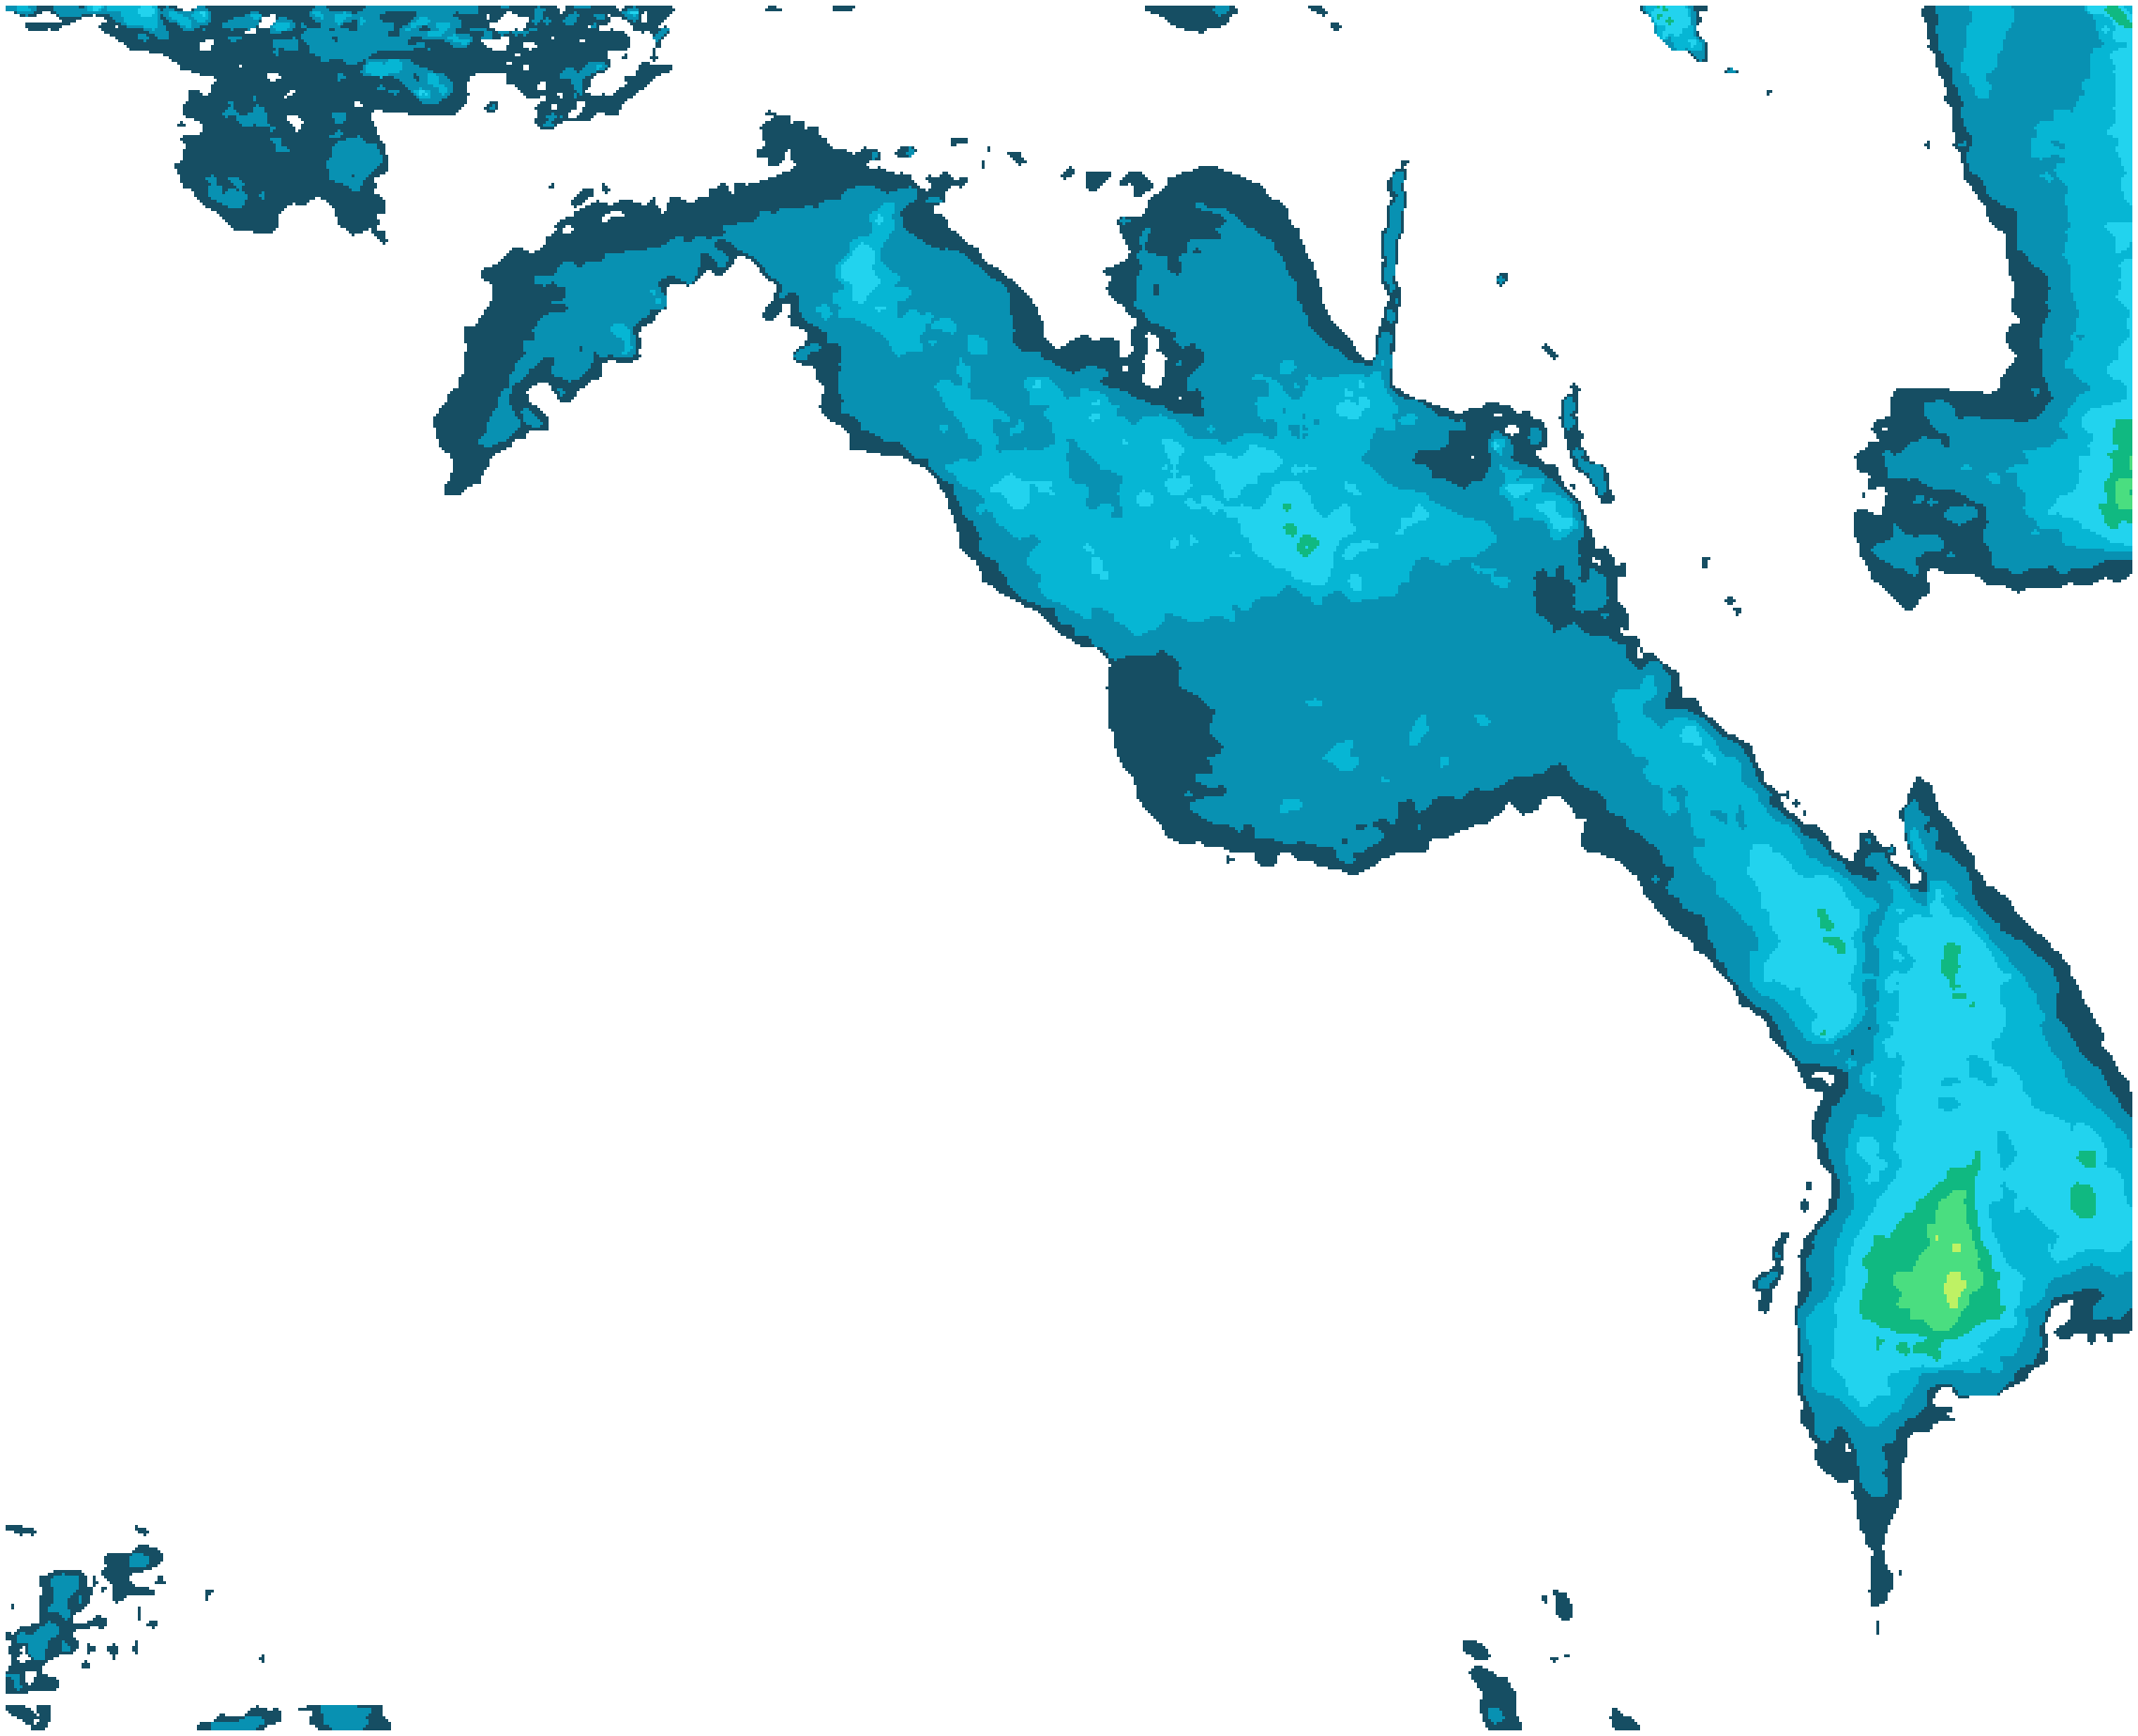
This thunderstorm map for Australia shows where storms may develop during the forecast period below. Each colour represents the chance of a thunderstorm at that location, while the issued and valid times identify the forecast run. Zoom into your region and tap any point to read its probability.
Forecast image sourced fromMeteologix
Plan for the rain
Rainfall forecast maps for Australia
Forecast maps by state and region
Choose Australia, a state or a local region for thunderstorm, daily rainfall and 7 day rainfall maps.
Regions by state
Queensland
New South Wales
Victoria
South Australia
Western Australia
Northern Territory
Regions by state
Queensland
New South Wales
Victoria
South Australia
Western Australia
Northern Territory
Regions by state
Queensland
New South Wales
Victoria
South Australia
Western Australia
Northern Territory
How this Australian thunderstorm outlook is made
Each map comes from multi-model thunderstorm guidance, which blends several global forecast models and works out how many of them expect storm conditions — enough instability, moisture and lift — at each location during the forecast window. Where most models agree, the chance is high and the shading is dark; where only a few agree, the chance stays low.
Source and updates
Published by Tim's Severe Weather from Tim's Severe Weather. A new map goes up when a fresh run arrives, typically once a day, and the issue and valid times above the map always show which run you are viewing in Australian eastern time.
What it can and cannot tell you
The colours give a broad regional chance, not the exact time, path or strength of an individual storm. Timing can run early or late by a few hours, small-scale sea breeze and mountain storms can be missed, and readings near the edge of the map are less reliable. Always check current warnings and radar close to the event.
How to use this forecast safely
These maps are forecast guidance, not warnings. Storm chances can change with every model run, and a small area can still be hit hard even where the chance looks low. Official severe thunderstorm and severe weather warnings from the Bureau of Meteorology always take priority. If a warning is current for your area, act on the warning.
This is not a live storm tracker. The probability map looks ahead to the stated valid period; live radar and lightning observations show storms that have already developed.
For live storm activity, use the lightning tracker and the rainfall radar. For the days ahead, see the rainfall and thunderstorm forecast.
Whole-of-Australia coverage
One national forecast map covering every state and territory, from the tropical north to Tasmania, with the same colour scale everywhere.
Clear issue and valid times
Every map shows when the forecast was produced and the period it covers, in Australian eastern time, so you always know how fresh it is.
Guidance, not a warning
Use this to plan travel, outdoor work and events. Bureau of Meteorology severe thunderstorm warnings always come first.
Frequently Asked Questions
Related Resources
Data Source
Data provided by Tim's Severe Weather
Update Frequency: Daily