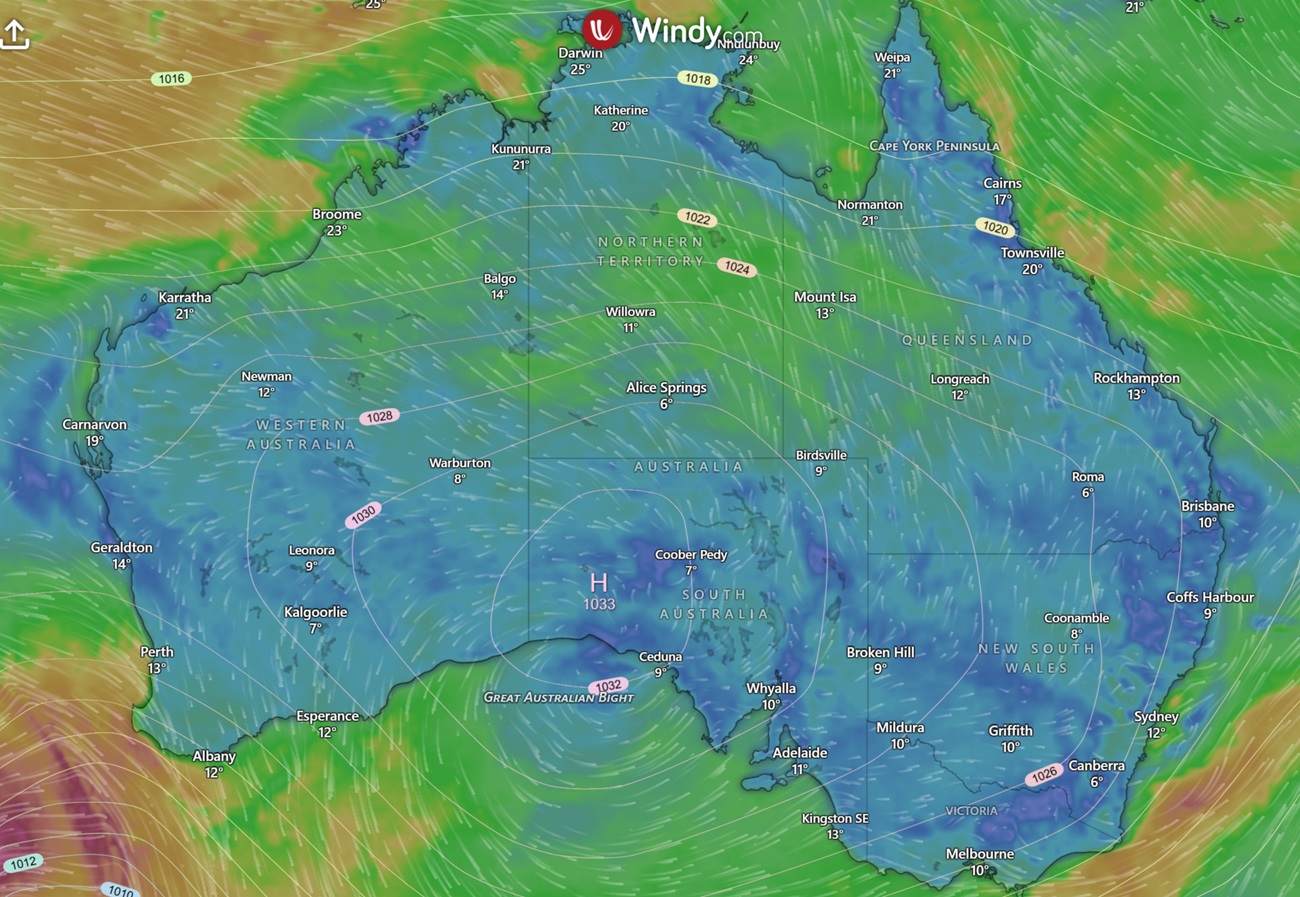
High and low pressure systems Australia explained: In the Southern Hemisphere, high pressure systems have sinking air and anticlockwise flow, while low pressure systems have rising air and clockwise flow. On a Bureau of Meteorology (BOM) synoptic chart, those patterns help explain why some days stay dry and clear while others turn cloudy, windy and wet.
Key takeaways
- High pressure systems, also called anticyclones, feature sinking air and are usually linked with settled weather.
- Low pressure systems feature rising air, which cools and condenses into cloud and rain.
- The Coriolis Effect in the Southern Hemisphere makes winds flow anticlockwise around highs and clockwise around lows.
- Isobars on a BOM synoptic chart show barometric pressure. Tight spacing usually means stronger winds.
- The Subtropical Ridge, Southern Ocean Cold Fronts, East Coast Lows and Monsoon Troughs all shape Australian weather through the year.
Atmospheric pressure in Australia explained
The basic science of barometric pressure
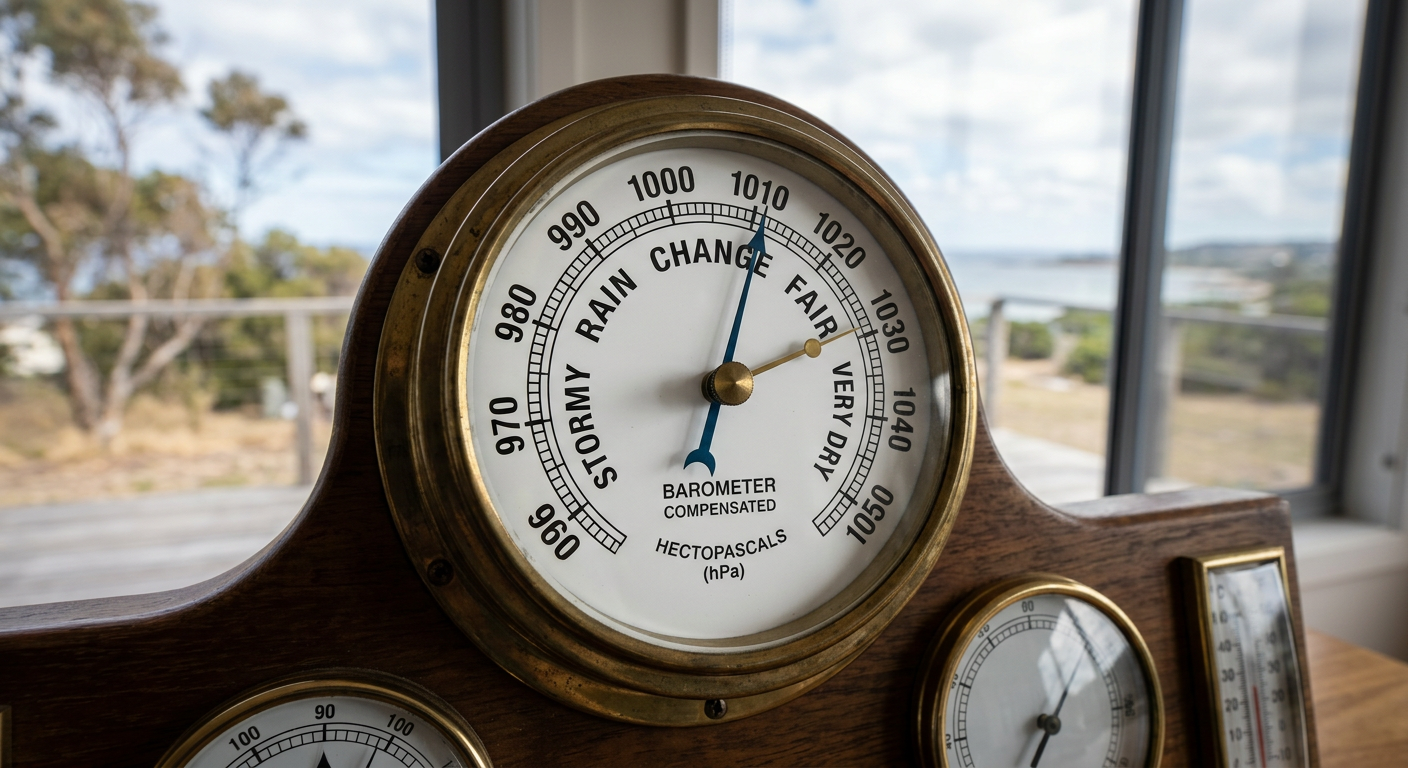
Atmospheric pressure is the weight of air pressing on the surface. Meteorologists measure it with a barometer and record it in hectopascals, or hPa. A synoptic chart shows this pressure pattern across a wide area, which is why it is one of the clearest tools for reading day-to-day weather.
When you open weather charts and maps, look for highs, lows, isobars and fronts. High pressure areas usually bring descending air. Low pressure areas usually bring rising air. That rising and sinking motion drives cloud, rain, wind and clear spells across Australia.
How to read a BOM synoptic chart for local conditions
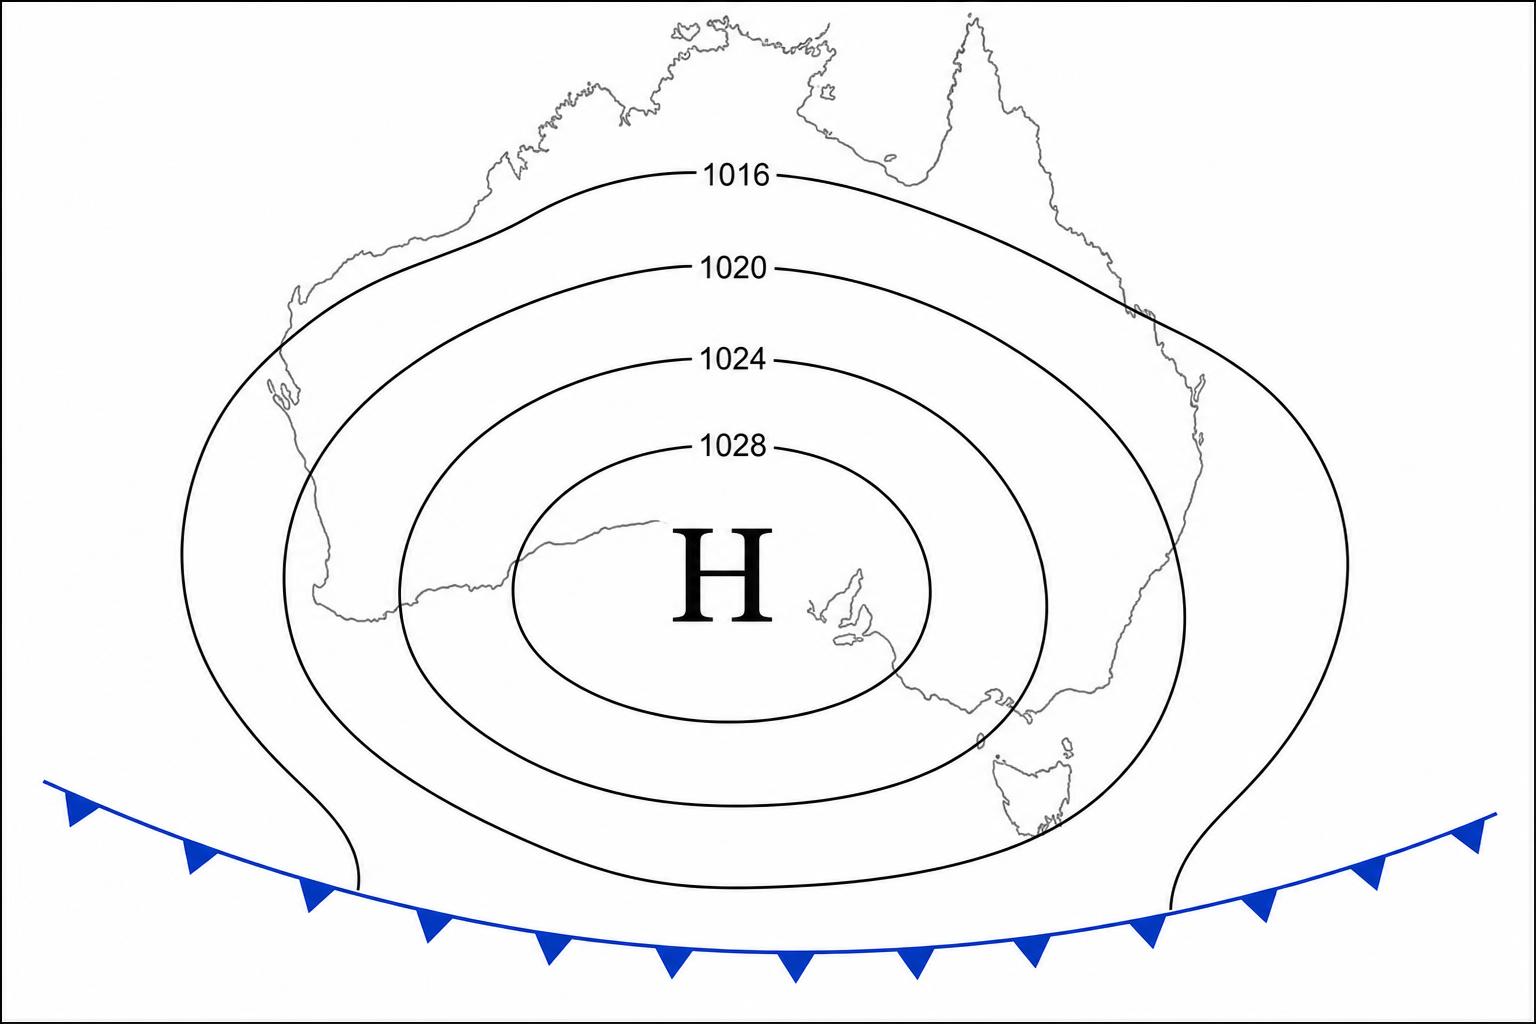
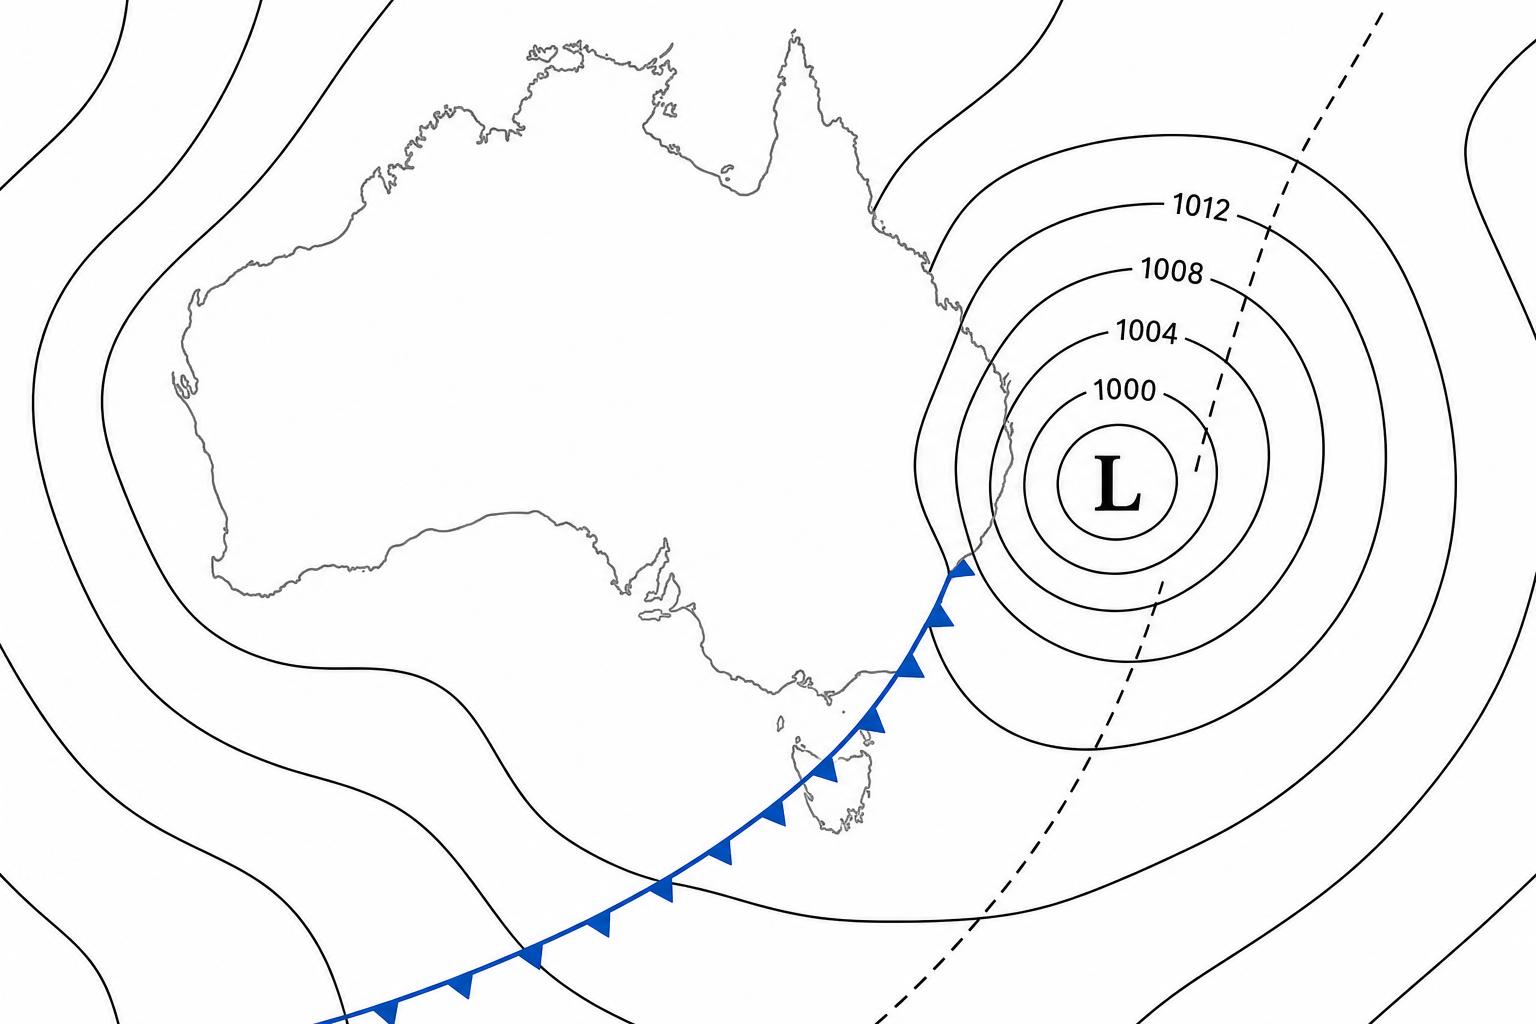
How to read a BOM synoptic chart for local conditions starts with the symbols. An H marks a high pressure system, an L marks a low pressure system, and the curved lines are isobars. These lines join places with the same barometric pressure. The BOM uses them to show where the air is tightly packed and where it is more spread out.
If the isobars are close together near your area, expect stronger winds. If they are far apart, winds are often lighter. A front, ridge or trough may also be drawn across the chart. Those features help explain where cloud bands, showers or a wind change may form next.
The Coriolis Effect in the Southern Hemisphere
The Coriolis Effect in the Southern Hemisphere is the reason winds do not move in straight lines around pressure systems. As air moves, Earth’s rotation turns it. Around a high, the flow is anticlockwise. Around a low, the flow is clockwise. That is the basic pattern used on BOM charts across Australia.
High pressure systems and anticyclones
Why anticyclones often bring clear skies
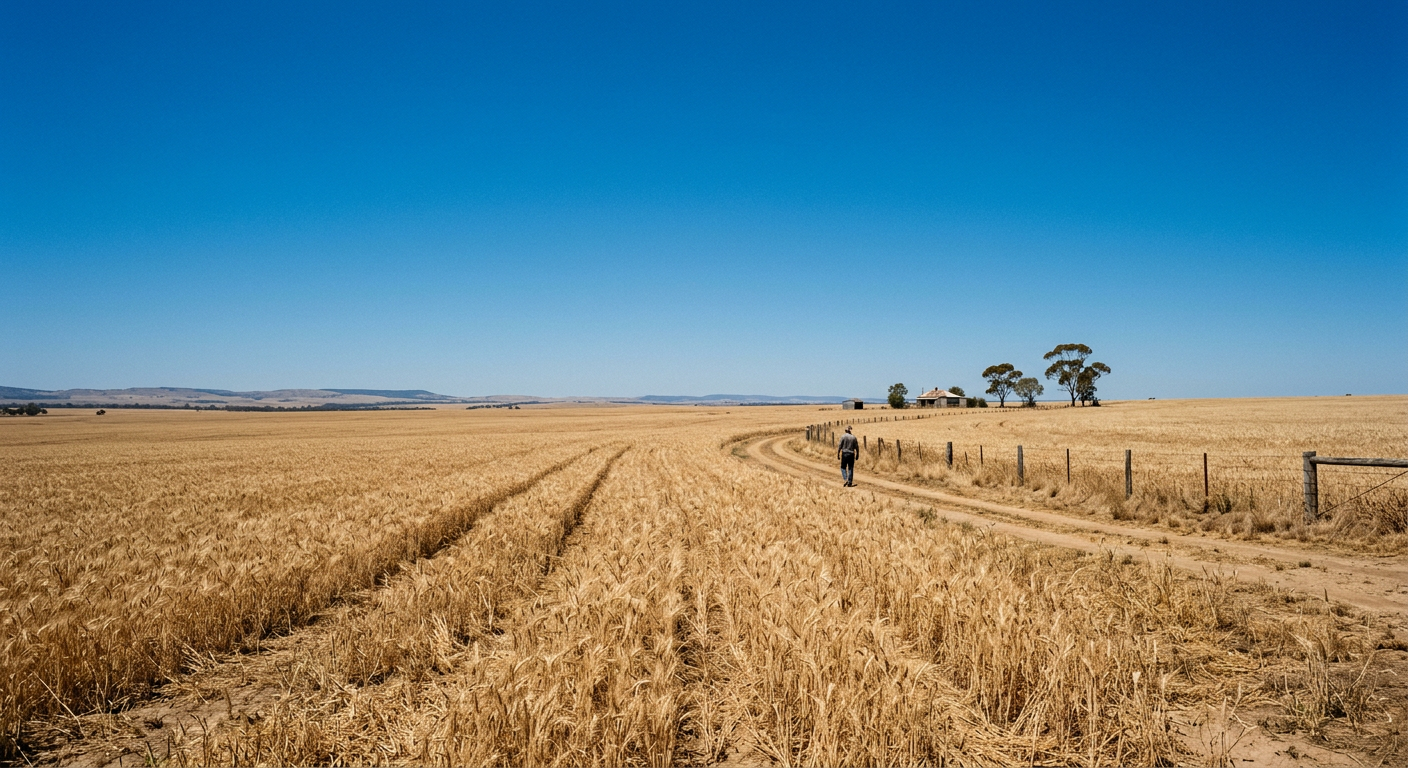
High pressure systems are also called anticyclones. Air sinks in the centre of an anticyclone, warms as it descends and makes cloud formation less likely. That is why highs often bring clear skies, light winds and dry weather. This is the pattern the BOM describes in its learning material and weather map guides.
Blocking highs are one special case. According to the Bureau of Meteorology, they are stationary high pressure systems that can sit over southern Australia for days to weeks. They can lock in dry weather, but they can also help set up heat, cold spells or wet periods depending on their position.
The Subtropical Ridge and the Great Australian Bight
The Subtropical Ridge is a belt of higher pressure that influences much of Australia’s weather. It helps steer systems across the continent and is one reason many southern areas see long runs of settled weather. When the ridge sits further south, it can help keep fronts and lows tracking below the mainland.
The Great Australian Bight often sits close to this high pressure belt. When a strong high lies to the south or south-west, it can shape the wind direction over southern Australia and affect how quickly cloud bands move across the state.
Winter frosts and summer heat
Clear nights under a high can lead to frost. With little cloud cover, the ground loses heat quickly after sunset. Calm winds also allow cold air to pool near the surface, especially inland and in valleys.
In summer, a slow-moving high can trap hot air over inland Australia or push hot air towards the south-east. The result can be several hot days in a row. If you are in exposed inland areas, watch for heatwave forecasts and high fire danger ratings.
Low pressure systems, troughs and rain belts
Why lows bring cloud and rain
Low pressure systems draw air inward at the surface and send it upward. As the air rises, it cools. Cooler air holds less moisture, so water vapour condenses into cloud. If the uplift is strong enough, showers or rain follow. That is why lows are often the systems that bring the broadest rain areas on a synoptic chart.
The BOM and ABC both describe this same basic pattern. Rising air tends to build cloud, while descending air tends to clear it. The difference is simple, but it explains a lot of Australian weather.
Southern Ocean Cold Fronts and weather fronts
Southern Ocean Cold Fronts are a major part of southern Australia’s weather. These fronts often move east with the westerly wind belt and can bring a sudden wind change, showers and a drop in temperature. They are closely linked with the broad low pressure systems that travel through the southern oceans.
A weather front is the boundary between air masses with different temperatures. Cold fronts are the most familiar to many Australians because they can bring a sharp change in conditions after a mild day.
The Roaring Forties
The Roaring Forties are strong westerly winds in the southern latitudes. They help carry fronts and low pressure systems across southern Australia and the surrounding oceans. When those winds are active, Tasmania, Victoria, South Australia and parts of Western Australia can see quick weather changes as fronts pass through.
East Coast Lows
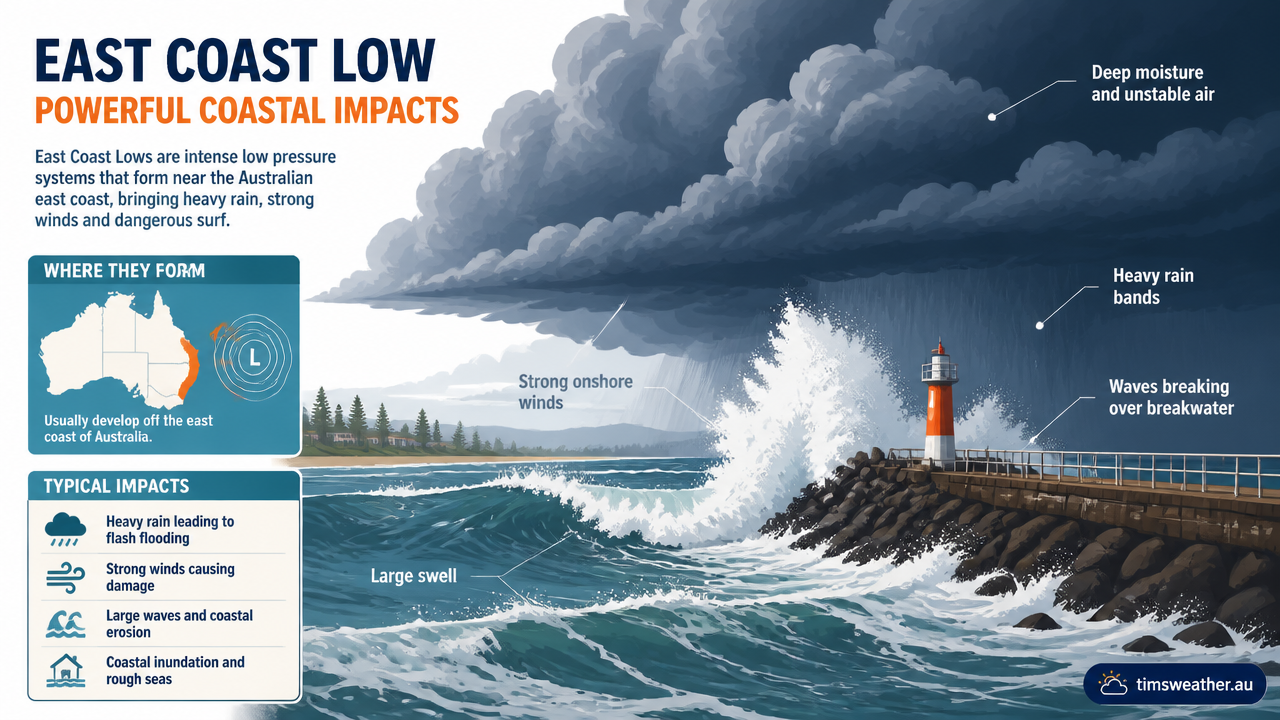
East Coast Lows are a separate type of low pressure system that can form near the New South Wales coast. The BOM says they can bring strong winds, heavy rain and rough seas. If you live on or near the coast, they are one of the most important low pressure systems to watch.
Monsoon Troughs
Monsoon Troughs are low pressure features that affect northern Australia, especially in the warmer months. They can help draw in moist air and support bands of cloud and rain across the north. For people in the Top End and northern Queensland, they are a major part of the wet season pattern.
Pressure patterns that shape Australian weather
Australia’s weather is shaped by the push and pull between highs, lows and fronts. In the south, the Subtropical Ridge and Southern Ocean Cold Fronts often control the weekly pattern. In the east, East Coast Lows can bring coastal rain and wind. In the north, Monsoon Troughs can draw in deep moisture. These systems do not act alone, but together they explain a lot of what you see on a BOM synoptic chart.
If you want to read your local forecast well, start with the pressure map, then check the positions of isobars, highs, lows and fronts. That gives you the best clue about whether your area is likely to stay calm, turn windy or pick up showers later in the day.
Related guides
Frequently asked questions
A high pressure system is an area where air sinks towards the surface, creating higher pressure than the surrounding atmosphere. In Australia, these systems typically bring settled weather with sunny skies and light winds. When a high sits over land, it often results in dry conditions and clear nights.
Source: bom.gov.au
Further reading and resources
Explore trusted articles, books, videos and other resources to go deeper on this topic.
bom.gov.auReference
Latest Colour Mean Sea-Level Pressure Analysis
Background reference on High and Low Pressure Systems Australia Explained: How to Read a BOM Synoptic Chart from bom.gov.au.
media.bom.gov.auReference
The art of the chart: how to read a weather map - Social Media Blog
Background reference on High and Low Pressure Systems Australia Explained: How to Read a BOM Synoptic Chart from media.bom.gov.au.
rmets.orgArticle
How to interpret a weather chart
In-depth coverage on High and Low Pressure Systems Australia Explained: How to Read a BOM Synoptic Chart from rmets.org.
Pressure: 4 Day Forecast Chart
Background reference on High and Low Pressure Systems Australia Explained: How to Read a BOM Synoptic Chart from bom.gov.au.
weatherzone.com.auArticle
Australian 7-Day Synoptic Charts
In-depth coverage on High and Low Pressure Systems Australia Explained: How to Read a BOM Synoptic Chart from weatherzone.com.au.
about.metservice.comArticle
How to read weather maps
In-depth coverage on High and Low Pressure Systems Australia Explained: How to Read a BOM Synoptic Chart from about.metservice.com.
abc.net.auArticle
How do high and low weather systems work? — ABC Science Archive
In-depth coverage on High and Low Pressure Systems Australia Explained: How to Read a BOM Synoptic Chart from abc.net.au.
warrengeography.weebly.comArticle
Synoptic Charts (Weather Maps)
In-depth coverage on High and Low Pressure Systems Australia Explained: How to Read a BOM Synoptic Chart from warrengeography.weebly.com.
scied.ucar.eduReference
The Highs and Lows of Air Pressure - UCAR Center for Science Education
Background reference on High and Low Pressure Systems Australia Explained: How to Read a BOM Synoptic Chart from scied.ucar.edu.
weather.metoffice.gov.ukReference
How to read synoptic weather charts
Background reference on High and Low Pressure Systems Australia Explained: How to Read a BOM Synoptic Chart from weather.metoffice.gov.uk.
Planning weeks ahead?
Check Australia's long-range seasonal outlook for rainfall, temperature and the climate drivers (ENSO, IOD, SAM, MJO) shaping the next three months.
View Australia's Seasonal Weather Forecast