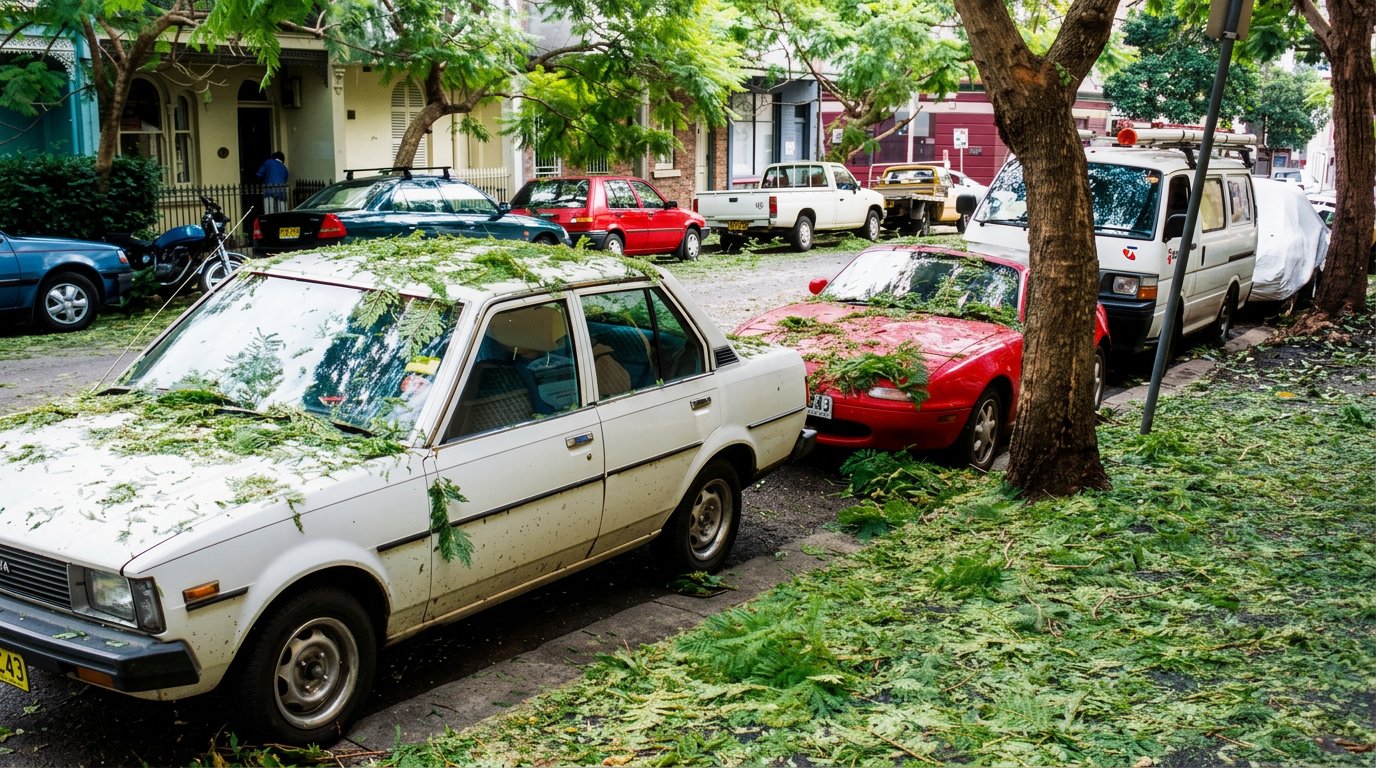
The 1999 Sydney hailstorm was one of Australia’s most damaging natural disasters, with nearly $9 billion in damages and more than 500,000 tonnes of ice falling on Sydney. It also exposed weaknesses in emergency response, with more than 40,000 assistance calls sent to the NSW State Emergency Service.
Key takeaways
The storm dropped more than 500,000 tonnes of ice across Sydney in a matter of hours.
Giant hailstones, including a 9 cm hailstone, smashed roofs, windows and vehicles across the city.
Bondi Junction, Paddington and Rose Bay were among the eastern suburbs that sustained the most damage from the extreme weather event.
Move cars under cover and stay away from windows when a severe thunderstorm warning is issued for your area.
The event exposed limits in BOM radar data at the time and pushed major upgrades to severe storm warning systems.
The weather setup behind the 1999 Sydney hailstorm
The storm formed when unstable air, moisture and strong wind shear lined up over the New South Wales coast. That combination helped a severe thunderstorm grow into a long-lived supercell thunderstorm, which is the type of storm most likely to produce giant hail and damaging winds.
A clash of unstable air masses
On 14 April 1999, warm, moist air over the coast met colder air aloft. That steep temperature contrast made the atmosphere unstable, so air rose quickly and built tall storm clouds. The storm drew on that energy near the Illawarra coast before tracking towards Sydney.
Meso-cyclonic structure and the Gorman-type supercell
Research on the event described a meso-cyclonic structure, which means a rotating updraft inside the storm. That rotation helped the storm stay organised and keep feeding on warm inflow. It is also why the event is often described as a Gorman-type supercell in Australian storm research.
In simple terms, the storm did not collapse after one burst of rain. The rotating updraft kept lifting moist air, which let hailstones grow larger before falling. That is the key reason a severe thunderstorm can become a major hailstorm.
The storm track from the Illawarra coast to Sydney
The storm moved from the Illawarra coast towards the Sydney metropolitan area, which placed suburbs in its path during the afternoon and early evening. It crossed into one of the most densely built parts of the city, so the damage was much worse than it would have been in a less populated area.
Suburbs including Bondi Junction, Moore Park, Kensington, Paddington, Rose Bay and Surry Hills were among the hardest hit. Sydney Airport (KSA) also saw damage to aircraft and ground equipment.
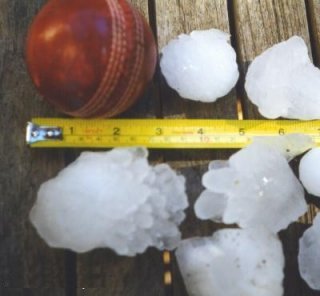
Hailstones dropped during the storm, compared to a cricket ball (7 cm or 2.8 in diameter). By The original uploader was Daniel at English Wikipedia. - Transferred from en.wikipedia to Commons., CC BY-SA 3.0, https://commons.wikimedia.org/w/index.php?curid=3100273
1999 Sydney hailstorm damage and hailstone diameter
The main reason this storm caused such large losses was the size and density of the hail. Large hailstones can break roofs, shatter glass and damage cars in minutes. See hail for the basics.
How big was the hail?
The largest confirmed hailstones from the event reached 9 cm in diameter. That is large enough to cause severe structural damage, especially when the hail falls over built-up suburbs. The storm also produced hail large enough to overwhelm skylights, terracotta tiles and vehicle windscreens.
Why the impacts were so severe
The storm combined large hail with intense rainfall and strong winds. That mix made the damage worse than hail alone. A rotating storm core can keep hail suspended longer, which allows it to grow before it falls. The downdrafts around the storm then pushed that hail into streets and rooftops with damaging force. See downdraft for a short explanation.
The event is often discussed in the context of insurance losses because the damage spread across homes, vehicles and businesses. The Insurance Council of Australia later used the storm as a key example of why severe storm planning matters for urban areas.
Micro-Burst Analysis of the 9cm Diameter Hailstone Strike
The title of this analysis points to one part of the damage story, but the key factor was the storm’s rotating structure and strong downdrafts. A micro-burst can intensify local damage by forcing air and hail down quickly, which increases the impact on roofs, cars and glass. In the 1999 event, that combination helped turn giant hail into extreme surface damage across the eastern suburbs.
Why the 1999 Sydney hailstorm bypassed forecasts
The storm exposed limits in the warning tools available at the time. The Bureau of Meteorology was working with older radar systems, which could show rain bands but could not clearly reveal rotation inside a storm. That made it harder to pick a supercell before it struck.
BOM radar data and the warning gap
Forecasters relied on BOM radar data that was much less detailed than modern Doppler radar. The radar could show where heavy rain was falling, but not the full internal wind structure of the storm. That meant the rotating core was easier to miss, even when the storm looked serious on the screen.
Post-event studies such as Meteorological Post-Mortem: Why the 14 April Supercell Bypassed Forecasts examined how those limits affected warning lead time. They showed why this storm became a turning point for radar upgrades and severe storm detection.
What the emergency response looked like
The NSW State EmergencyService received more than 40,000 assistance calls as the storm moved through Sydney. SES volunteers carried out a large response, helping with roof damage, broken windows and other storm impacts. The event became a clear case study in how an emergency services response needs to scale quickly after a major city hailstorm.
For readers in storm season, the main lesson is simple: if a severe thunderstorm warning is issued, move cars under cover if you can, bring pets inside and keep away from windows.
How the 1999 Sydney hailstorm changed insurance and disaster planning
The storm changed the way insurers, councils and emergency planners think about severe hail in a major city. Nearly $9 billion in damages put a sharp focus on roof strength, vehicle exposure and the cost of dense urban development.
The Insurance Council of Australia has often pointed to the event as a benchmark for hail risk in Sydney. It remains one of the clearest examples of how a supercell thunderstorm can become a catastrophic natural disaster without cyclonic winds or floodwater.
Why the event still matters
The 1999 hailstorm showed that severe thunderstorms can cause damage on a scale usually linked with much larger natural hazards. It also showed why warning systems, radar coverage and public response need to work together. If you live in eastern Australia, this is a useful reminder that a fast-moving severe storm can still do major damage in a short time.
Related guides
Frequently asked questions
A severe supercell thunderstorm caused the April 1999 Sydney hailstorm. This long-lived, rotating storm system generated exceptionally large hail, destructive winds, and intense rain. It is regarded as one of the most damaging weather events in Australian history due to its path over densely populated metropolitan suburbs.
Source: bom.gov.au
Planning weeks ahead?
Check Australia's long-range seasonal outlook for rainfall, temperature and the climate drivers (ENSO, IOD, SAM, MJO) shaping the next three months.
View Australia's Seasonal Weather Forecast