
How does La Niña form? La Niña forms when the Pacific trade winds strengthen, driving warm surface water westward and allowing cooler, nutrient-rich deep water to rise in the central and eastern equatorial Pacific. This upwelling creates a self-reinforcing feedback loop that alters the Walker circulation and sustains below-average sea surface temperatures across the region.
Key takeaways
La Niña represents the cool phase of the El Niño Southern Oscillation (ENSO) cycle.
The event begins when the equatorial easterly winds intensify across the Pacific Ocean.
Stronger trade winds tilt the thermocline, boosting the upwelling of cold water in the eastern Pacific.
This process initiates a coupled ocean-atmosphere feedback loop that reinforces cooler sea surface temperatures.
Changes in the tropical Pacific eventually influence global weather patterns by shifting the Walker circulation.
How does La Niña form: the physical oceanography
Ocean-atmosphere coupling and the Bjerknes feedback
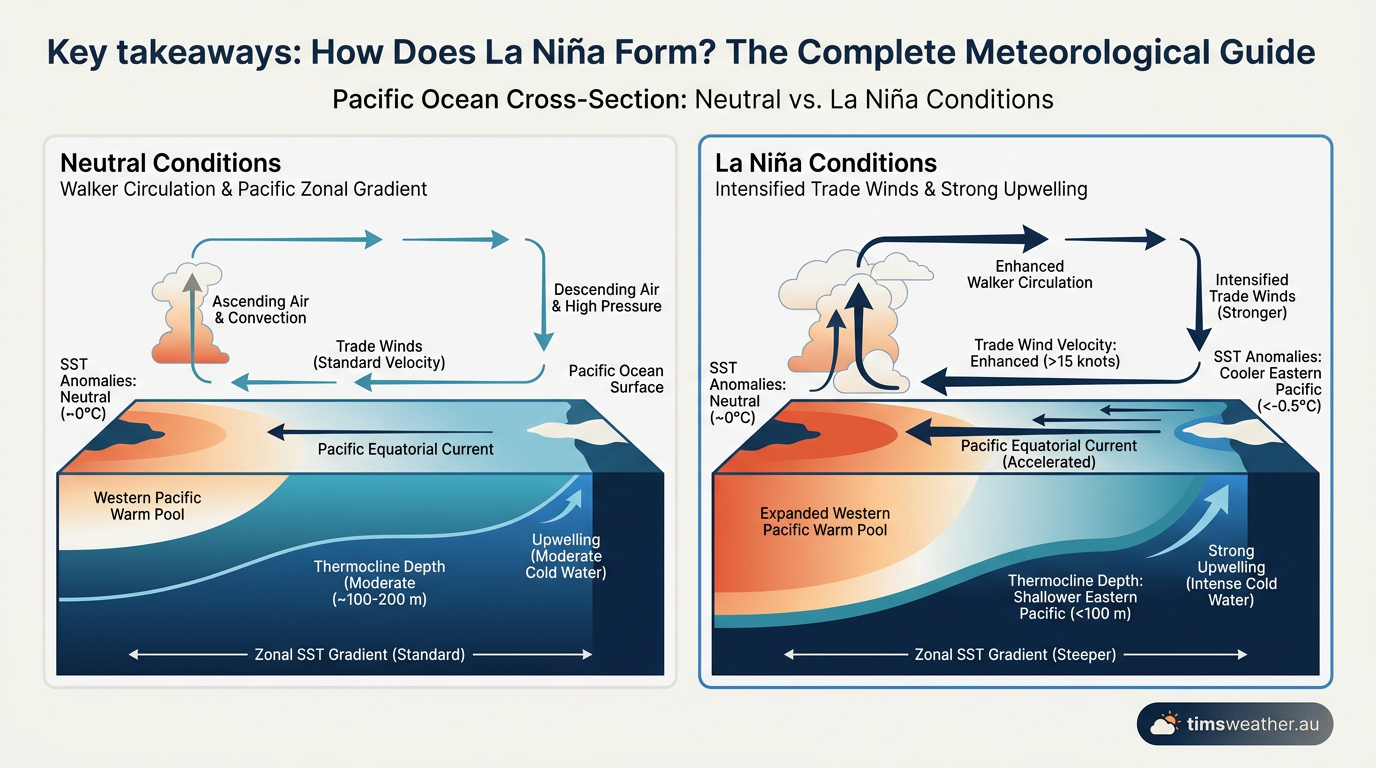
La Niña is not merely an ocean phenomenon; it is a coupled system. This means the ocean drives changes in the atmosphere, and the atmosphere simultaneously drives changes in the ocean. This relationship is best explained by the Bjerknes feedback, named after the meteorologist Jacob Bjerknes. When the eastern Pacific cools, the air above it cools and becomes denser, leading to higher surface pressure. Meanwhile, the warm water in the west heats the air, causing it to rise and creating lower surface pressure.
This stark difference in pressure causes air to flow from the high-pressure area in the east to the low-pressure area in the west, which effectively strengthens the trade winds. Carbon Brief explains that this feedback mechanism is why the climate state can strengthen itself once it begins. The stronger winds cause more upwelling, which causes more cooling, which further strengthens the pressure gradient. This loop is the defining characteristic of the ENSO cycle.
Local meteorologists and regional weather updates often highlight this exact loop when explaining prolonged seasonal forecasts to the public, as the continuous feedback can lock regional weather into a fixed pattern for many months.
How do trade winds influence La Niña development?
Trade winds influence La Niña development by physically acting as the mechanical driver of the ocean currents. By blowing strongly from east to west across the equator, they strip away the warm surface layer in the eastern Pacific. This wind action directly controls the rate of upwelling and sets the Bjerknes feedback loop in motion.
Without the sustained push of the equatorial easterlies, the warm water piled in the western Pacific would slowly slosh back toward the Americas under the force of gravity. The trade winds must maintain their anomalous strength to fight this natural gravity wave (known as a Kelvin wave). When the winds eventually weaken, the cooling process stalls, signalling the beginning of the end for the event.
The impact of the Walker circulation
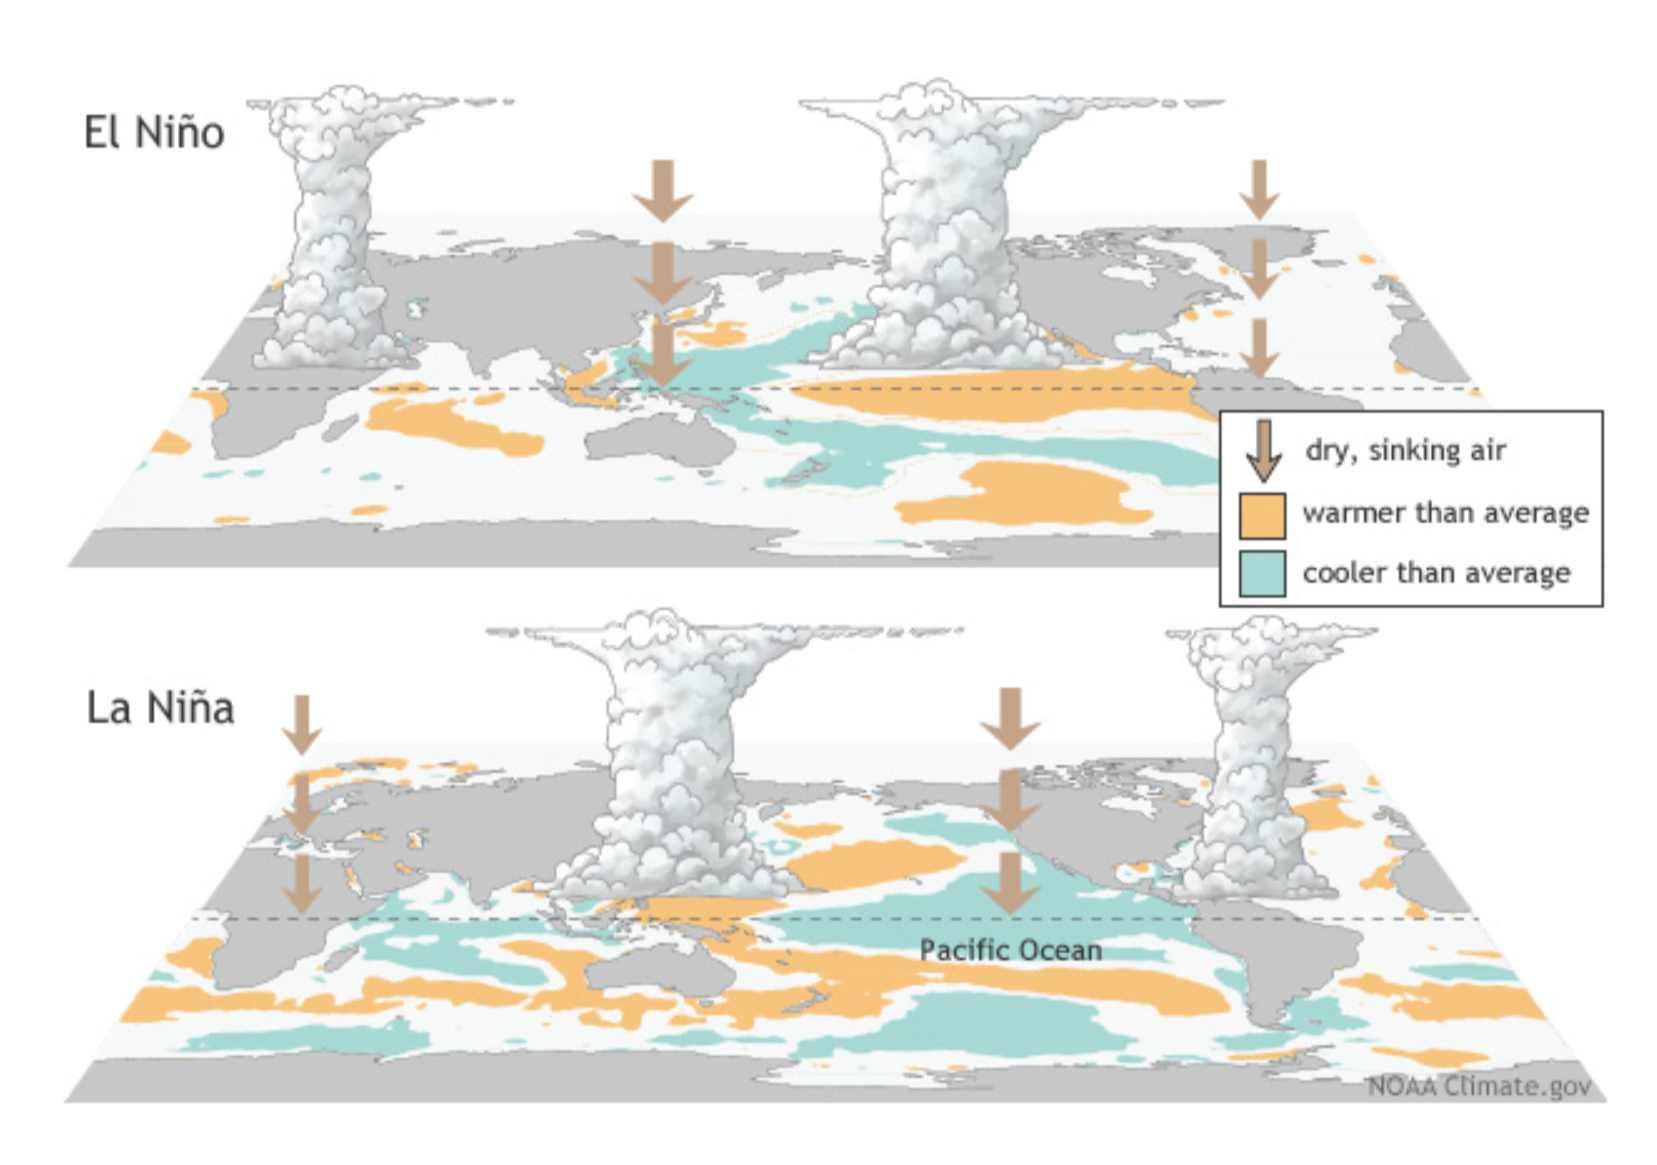
The Walker circulation is the vast, east-west atmospheric loop operating over the equatorial Pacific. In a normal year, air rises over the warm western Pacific, travels eastward high in the troposphere, sinks over the cooler eastern Pacific, and returns westward along the surface as the trade winds. During La Niña, this entire circulation shifts into overdrive.
The intensified Walker circulation alters where atmospheric convection occurs. The zone of heavy rainfall shifts further west, leading to intense precipitation over Indonesia and Australia. How how do low-pressure systems form in these regions is heavily dependent on this steady supply of rising, moisture-laden air. Conversely, the eastern Pacific experiences intense subsidence (sinking air), which suppresses cloud formation. Examining how do high-pressure systems form reveals why the sinking branch of the Walker circulation leaves the South American coast exceptionally dry during these months.
Distinguishing ENSO phases and thresholds
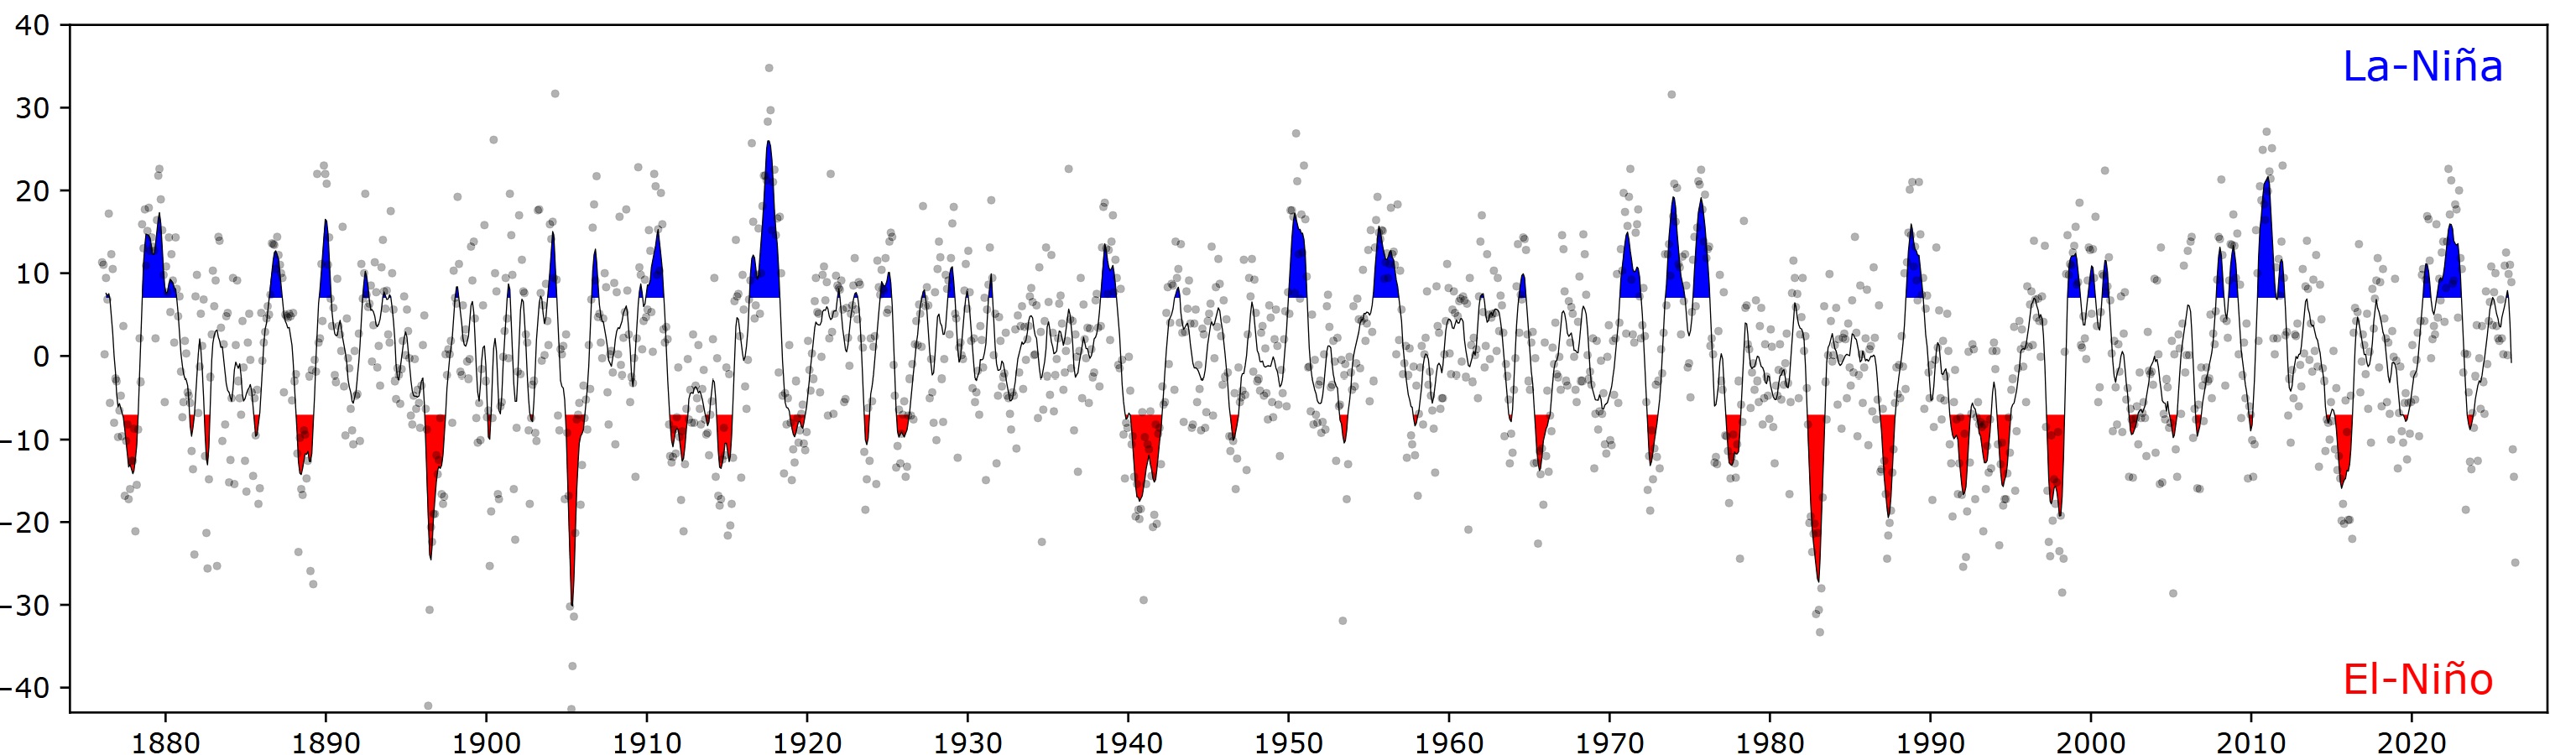
The global climate constantly swings between three primary states: El Niño, La Niña, and ENSO-neutral. While the physical location of the cycle remains the equatorial Pacific, the oceanic and atmospheric indicators look completely different depending on the active phase. Forecasters do not declare an event based on a single cold week; they look for sustained anomalies that prove the ocean and atmosphere are fully coupled.
The National Oceanic and Atmospheric Administration maintains strict criteria for declaring these phases, often tracking the Relative Oceanic Niño Index (RONI) to gauge the underlying ocean heat content before making an official call. This rigorous measurement ensures that temporary weather fluctuations are not confused with major seasonal shifts.
What is the difference between El Niño and La Niña formation?
The difference between El Niño and La Niña formation lies in the trade winds and ocean temperatures. El Niño forms when trade winds weaken, allowing warm water to slide eastward and heat the central Pacific. La Niña forms when trade winds strengthen, pushing warm water westward and allowing cold water to upwell in the east.
If you want to read a full breakdown of the warm phase, studying how does El Niño form provides the exact mirror image of the cooling process. Both phases represent extreme ends of the same pendulum.
ENSO Phase | Trade Winds | Sea Surface Temperatures (East) | Thermocline Depth (East) |
|---|---|---|---|
ENSO-Neutral | Near average | Near average | Moderate depth (~40-50m) |
La Niña | Stronger easterlies | Cooler than average | Very shallow |
El Niño | Weaker easterlies | Warmer than average | Much deeper |
Monitoring the Oceanic Niño Index (ONI)
The most common metric used by the international meteorological community to track the cycle is the Oceanic Niño Index (ONI). This index measures the rolling three-month average of sea surface temperature anomalies in a specific region of the central Pacific known as the Niño 3.4 region. For a La Niña event to be officially recognised by most global agencies, the ONI must drop to -0.5°C or lower for at least five consecutive overlapping three-month periods.
Different agencies apply slightly different thresholds based on their regional impacts. The Australian Bureau of Meteorology, for example, typically requires sustained Niño 3.4 anomalies below -0.8°C alongside corroborating atmospheric signals before officially declaring an active event. This strict requirement ensures that the atmosphere has truly coupled with the ocean. The heat stored in the ocean is a critical variable globally, just as it is when forecasting how do tropical cyclones form in nearby oceanic basins.
The Southern Oscillation Index
While the ONI measures the ocean, the Southern Oscillation Index (SOI) measures the atmosphere. The SOI tracks the difference in surface air pressure between Tahiti and Darwin, Australia. During La Niña, surface pressure is unusually high in Tahiti and unusually low in Darwin, resulting in a strong positive SOI value.
Consistent positive SOI values (typically above +7) indicate a La Niña episode and stronger Pacific trade winds, but they do not by themselves confirm that the Walker circulation has intensified. When the ocean temperature index and the atmospheric pressure index align, forecasters have high confidence that the climate system is fully locked into a cool phase. If the ocean is cold but the SOI remains near zero, the system is uncoupled and the event will likely fail to mature.
Global teleconnections and meteorological forecasting
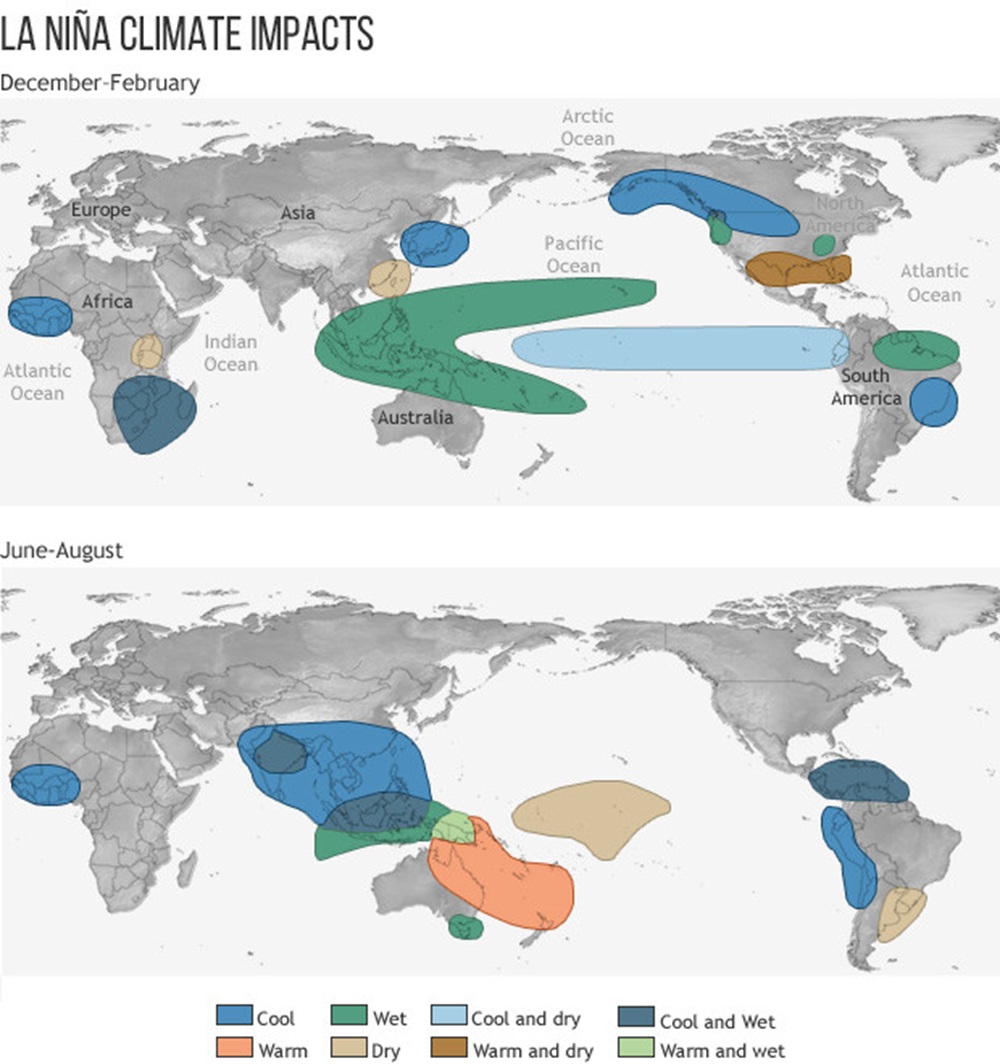
When the tropical Pacific alters its heat distribution, the entire global atmosphere must adjust. These long-distance climate links are called teleconnections. Because the western Pacific becomes a massive engine of heat and moisture, it pumps enormous amounts of energy into the upper atmosphere. This energy travels poleward and changes atmospheric waves in the mid-latitudes, which dictates how does the jet stream form and meander across the hemispheres.
Scripps Oceanography notes that these Pacific anomalies trigger a chain reaction that shifts storm tracks, alters monsoon timing, and changes drought risk far beyond the tropics. In North America, the polar jet stream tends to dip further south over the Midwest while the Pacific jet stream retreats northward, leaving the southern United States unusually dry and warm.
How ensemble models predict the cycle
Modern forecasters do not rely solely on current observations; they use complex supercomputers to run climate models. Systems like the European Centre for Medium-Range Weather Forecasts (ECMWF) and the NOAA Climate Forecast System (CFSv2) generate ensemble plumes. An ensemble plume is a chart showing dozens of slightly different model runs overlaid on one another to map out the most likely future path of the Niño 3.4 index.
These models calculate millions of data points involving ocean heat content, wind stress, and subsurface Kelvin waves. By looking at how these variables interact, the models can predict the onset of a cool phase up to nine months in advance. The moisture availability over the western Pacific also dictates how do cumulus clouds form and group into massive convective clusters, which the models track to calculate latent heat release into the upper troposphere.
Historical tracking and official declarations
Climate agencies issue regular bulletins to keep the public and agricultural sectors informed. For instance, the World Meteorological Organization (WMO) carefully tracks the decay of these events. In the most recent documented cycle, the WMO noted in February 2026 that weak La Niña conditions were fading, issuing a forecast that showed a 60% chance of ENSO-neutral conditions returning by the March–May period, and only a 30% chance of the cooling continuing.
By the time the WMO released its April 2026 global seasonal update, it confirmed the equatorial Pacific had fully transitioned from a weakening cool phase to ENSO-neutral during the February–April window. The 2025–26 episode was described as a borderline or weak event, which is significant because weaker events often produce less reliable teleconnections. Such transitions are highly anticipated by forecasters, who often debate whether lingering warm water from previous years might alter the Super El Niño Australia impact during the next phase of the cycle. These historical shifts are frequently communicated via broadcast meteorological summaries to help communities prepare for changing seasonal risks.
Frequently asked questions
La Niña forms when easterly trade winds strengthen across the tropical Pacific. These powerful winds push warm surface waters westward towards Australia and Indonesia. This displacement allows cooler, nutrient-rich water from the deep ocean to rise to the surface in the eastern Pacific, creating a distinct cooling effect across the region.
Source: science.nasa.gov
Further reading and resources
Explore trusted articles, books, videos and other resources to go deeper on this topic.
niwa.co.nzArticle
El Niño and La Niña | Earth Sciences New Zealand - NIWA
In-depth coverage on How Does La Niña Form? The Complete Meteorological Guide from niwa.co.nz.
weather.govReference
NWS Jackson, MS: El Nino and La Nina
Background reference on How Does La Niña Form? The Complete Meteorological Guide from weather.gov.
khanacademy.orgArticle
El Niño and La Niña (video) | Khan Academy
In-depth coverage on How Does La Niña Form? The Complete Meteorological Guide from khanacademy.org.
climate.govReference
What is the El Niño–Southern Oscillation (ENSO) in a nutshell?
Background reference on How Does La Niña Form? The Complete Meteorological Guide from climate.gov.
El Niño & La Niña (El Niño-Southern Oscillation) | NOAA Climate.gov
Background reference on How Does La Niña Form? The Complete Meteorological Guide from climate.gov.
weather.comArticle
Your Complete Guide To Everything El Niño | Weather.com
In-depth coverage on How Does La Niña Form? The Complete Meteorological Guide from weather.com.
youtube.comVideo
El Niño and La Niña Explained - YouTube
Video coverage on How Does La Niña Form? The Complete Meteorological Guide from youtube.com.
en.wikipedia.orgReference
El Niño–Southern Oscillation - Wikipedia
Background reference on How Does La Niña Form? The Complete Meteorological Guide from en.wikipedia.org.
oceanservice.noaa.govReference
What are El Nino and La Nina? - NOAA's National Ocean Service
Background reference on How Does La Niña Form? The Complete Meteorological Guide from oceanservice.noaa.gov.
El Niño and La Niña Explained - YouTube
Video coverage on How Does La Niña Form? The Complete Meteorological Guide from youtube.com.
Planning weeks ahead?
Check Australia's long-range seasonal outlook for rainfall, temperature and the climate drivers (ENSO, IOD, SAM, MJO) shaping the next three months.
View Australia's Seasonal Weather Forecast